. 2009 Jun 5;284(23):15980-92.
doi: 10.1074/jbc.M809399200. Epub 2009 Apr 1.

FRS2 via fibroblast growth factor receptor 1 is required for platelet-derived growth factor receptor beta-mediated regulation of vascular smooth muscle marker gene expression

Affiliations

FRS2 via fibroblast growth factor receptor 1 is required for platelet-derived growth factor receptor beta-mediated regulation of vascular smooth muscle marker gene expression

Pei-Yu Chen et al. J Biol Chem. .

Erratum in

  • J Biol Chem. 2012 Jan 6;287(2):1609

Abstract

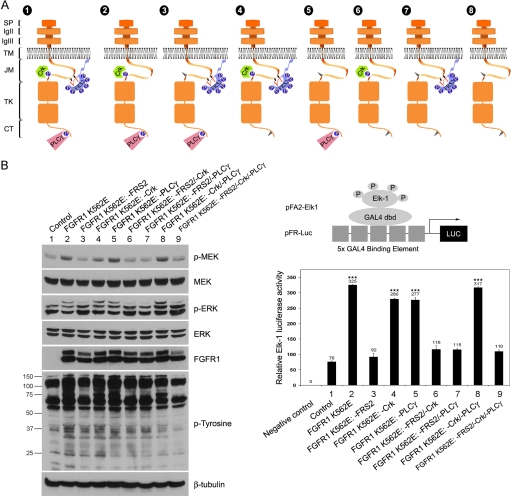
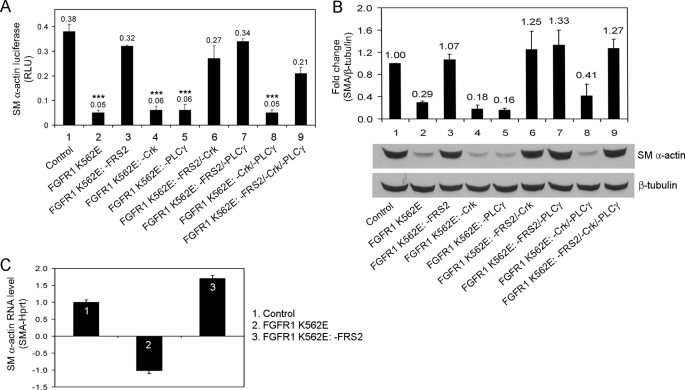
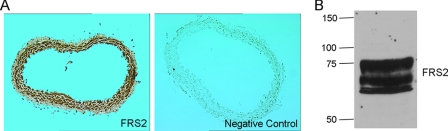
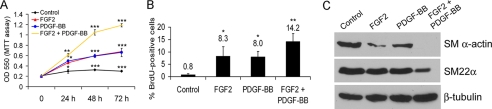
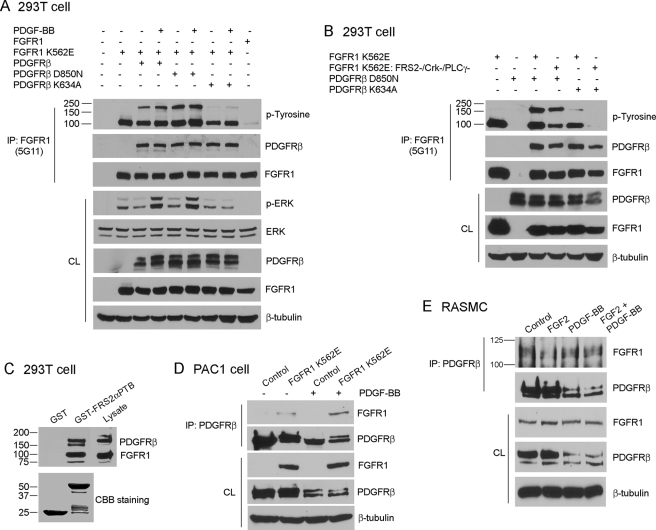
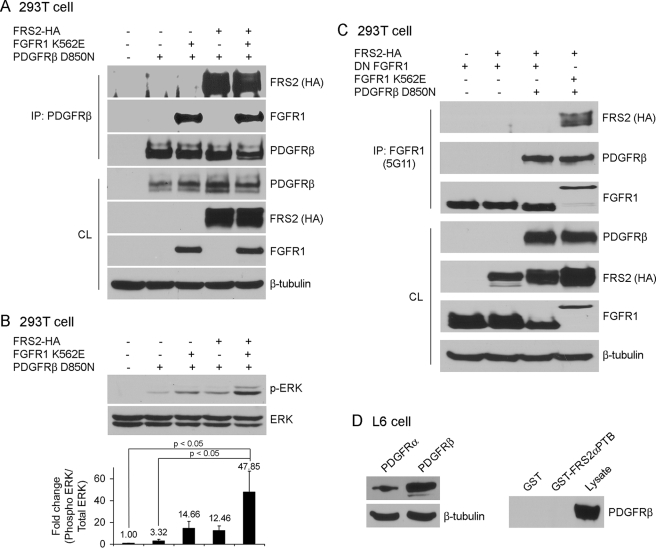
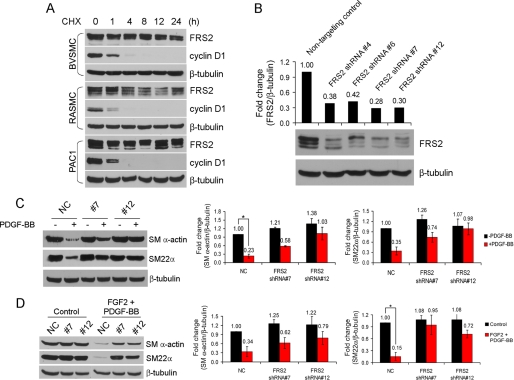
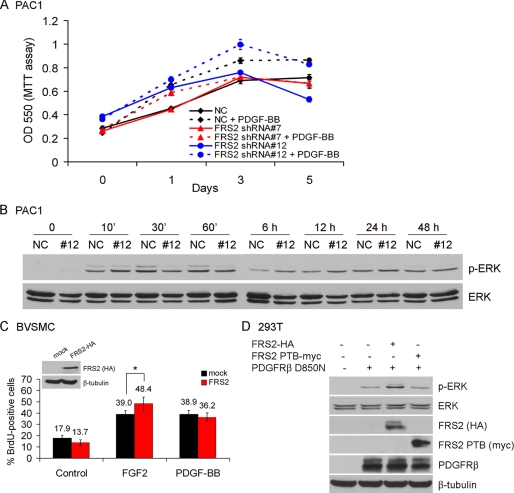
Vascular smooth muscle cells (VSMC) exhibit phenotypic plasticity and change from a quiescent contractile phenotype to a proliferative synthetic phenotype during physiological arteriogenesis and pathological conditions such as atherosclerosis and restenosis. Platelet-derived growth factor (PDGF)-BB is a potent inducer of the VSMC synthetic phenotype; however, much less is known about the role of fibroblast growth factor-2 (FGF2) in this process. Here, we show using signal transduction mutants of FGF receptor 1 (FGFR1) expressed in rat VSMC that the adaptor protein FRS2 is essential for FGFR1-mediated phenotypic modulation and down-regulation of VSMC smooth muscle alpha-actin (SMA) gene expression. In addition, we show that PDGF-BB and FGF2 act synergistically to induce cell proliferation and down-regulate SMA and SM22alpha in VSMC. Furthermore, we show that PDGF-BB induces tyrosine phosphorylation of FGFR1 and that this phosphorylation is mediated by PDGF receptor-beta (PDGFRbeta), but not c-Src. We demonstrate that FRS2 co-immunoprecipitates with PDGFRbeta in a complex that requires FGFR1 and that both the extracellular and the intracellular domains of FGFR1 are required for association with PDGFRbeta, whereas the cytoplasmic domain of FGFR1 is required for FRS2 association with the FGFR1-PDGFRbeta complex. Knockdown of FRS2 in VSMC by RNA interference inhibited PDGF-BB-mediated down-regulation of SMA and SM22alpha without affecting PDGF-BB mediated cell proliferation or ERK activation. Together, these data support the notion that PDGFRbeta down-regulates SMA and SM22alpha through formation of a complex that requires FGFR1 and FRS2 and prove novel insight into VSMC phenotypic plasticity.


Figures

FIGURE 1.
FIGURE 1.
Diagrams of FGFR1 mutants and biochemical characterization. A, schematic representation of FGFR1 K562E mutant constructs. Construct 1, FGFR1 K562E; construct 2, FGFR1 K562E: −FRS2; construct 3, FGFR1 K562E: −Crk; construct 4, FGFR1 K562E: −PLCγ; construct 5, FGFR1 K562E: −FRS2/−Crk; construct 6, FGFR1 K562E: −FRS2/−PLCγ; construct 7, FGFR1 K562E: −Crk/−PLCγ; construct 8, FGFR1 K562E: −FRS2/−Crk/−PLCγ. SP, signal peptide; Ig, immunoglobulin-like domain; TM, transmembrane domain; JM, juxtamembrane domain; TK, tyrosine kinase; CT, C-terminal regulatory tail. B, effects of FGFR1 K562E mutants on ERK signaling in PAC1 VSMC. Left panel, PAC1 stable cell lines were cultured in 10% FBS medium for 24 h and then switched to 0.5% FBS medium overnight. The cells were lysed, and the cell lysates were subjected to Western blot analysis and probed with indicated antibodies. β-Tubulin served as a loading control. The molecular masses are indicated on the left in kilodaltons. Right panel, upper panel, Diagram of the PathDetect transreporting system used in this study (pFA/pFR-Luc; Stratagene). Lower panel, PAC1 cells were transfected with pFA2-CMV and pFR-Luc. The pFA2-dbd plasmid was used as a negative control. After 24 h, the cells were lysed, and luciferase activities were measured. Graphed are the means ± S.D. of triplicate samples. Statistical analysis was performed by using one-way ANOVA test. ***, p < 0.001, compared with the control. All of the results are representative of three separate experiments.
FIGURE 2.
FIGURE 2.
Effects of FGFR1 FRS2 deletion mutants on SM α-actin gene expression. A, PAC1 stable cell lines expressing FGFR1 mutants were transiently transfected with SM α-actin luciferase reporter and pRL-TK Renilla luciferase. The cells were serum-starved overnight and analyzed for luciferase activity. The results are displayed as the means ± S.D. ***, p < 0.001, as compared with the control (ANOVA test; n = 3). RLU, relative luciferase units. B, PAC1 stable cell lines were analyzed for SM α-actin expression by immunoblotting. Quantification of SM α-actin and normalization were described under “Experimental Procedures.” The values were reported as the means ± S.D. and compared with the control (ANOVA test; n = 3). C, PAC1 stable cell lines were analyzed for SM α-actin mRNA expression by real time quantitative PCR. The data were normalized to Hprt and were expressed as the fold difference from the vector control cells. The results are representative of three separate experiments.
FIGURE 3.
FIGURE 3.
FRS2 expression in vessels. A, immunohistochemical staining of FRS2 in mouse aorta sections. B, expression of FRS2 in mouse aorta extracts. Three aortas from 2-month-old FVB mice were isolated. Tissues were lysed and subjected to immunoblot analysis. The molecular masses are indicated on the left in kilodaltons. The results are representative of three separate experiments.
FIGURE 4.
FIGURE 4.
Effects of FGF2 and PDGF-BB on primary BVSMC cell proliferation and VSMC marker gene expression. A, BVSMC were serum-starved overnight and treated with growth factor(s) (20 ng/ml FGF2, 50 ng/ml PDGF-BB) or left untreated for the indicated time points. Cell proliferation was determined using the MTT assay. Statistical analysis was performed by Student's t test. *, p < 0.05; **, p < 0.01; ***, p < 0.001, compared with each time point of the control. B, BVSMC were serum-starved overnight and treated with growth factor(s) (20 ng/ml FGF2, 50 ng/ml PDGF-BB) or left untreated for 24 h. The cells were pulse-labeled with 10 μm BrdUrd for 1 h, and the BrdUrd-positive cells were quantified. Statistical analysis was performed by Student's t test. *, p < 0.05; **, p < 0.01, compared with the control. C, BVSMC were serum-starved overnight, stimulated with growth factor(s) (20 ng/ml FGF2, 50 ng/ml PDGF-BB) or left untreated for 72 h, and analyzed for smooth muscle marker gene expression by immunoblotting. β-Tubulin served as a loading control. All of the results are representative of three separate experiments.
FIGURE 5.
FIGURE 5.
PDGF-BB transactivates FGFR1. A, BVSMC were serum-starved overnight, stimulated with growth factors (20 ng/ml FGF2, 50 ng/ml PDGF-BB) or left untreated for 24 h, and analyzed for FGFR1 and FRS2 phosphorylation by immunoblotting. β-Tubulin served as a loading control. B, VSMC were analyzed for expression of PDGFRs and FGFRs by immunoblotting. C, 293T cells were transiently transfected with different constructs as indicated. After serum starvation overnight, FGFR1 was immunoprecipitated (IP) and subjected to immunoblot analysis. The amount of transfected proteins in the cell lysate (CL) were also analyzed by immunoblotting. β-Tubulin served as a loading control. All of the results are representative of three separate experiments.
FIGURE 6.
FIGURE 6.
FGFR1 and PDGFRβ form a complex. A and B, 293T cells were transiently transfected with different constructs as indicated. After serum starvation overnight, FGFR1 was immunoprecipitated (IP) and subjected to immunoblot analysis. The amount of transfected proteins in the cell lysate (CL) were also analyzed by immunoblotting. β-Tubulin served as a loading control in all experiments. C, 293T cells were transiently transfected with FGFR1 and PDGFRβ constructs. After serum starvation overnight, the cells were lysed, and the cell lysates were precleared with glutathione-Sepharose alone before incubation with GST or GST-FRS2αPTB fusion proteins bound to glutathione-Sepharose. The precipitates were subjected to immunoblot analysis. D, PAC1 stable cell lines were stimulated with 50 ng/ml PDGF-BB or left untreated for 24 h after 0.5% FBS starvation overnight. PDGFRβ was immunoprecipitated and subjected to immunoblot analysis. β-Tubulin served as a loading control. E, RASMC were stimulated with growth factor(s) (20 ng/ml FGF2, 50 ng/ml PDGF-BB) or left untreated for 24 h after 0.5% FBS starvation overnight. PDGFRβ was immunoprecipitated and subjected to immunoblot analysis. β-Tubulin served as a loading control. The molecular masses are indicated on the left in kilodaltons. All of the results are representative of three separate experiments.
FIGURE 7.
FIGURE 7.
FRS2 participates in PDGFRβ signaling. A–C, 293T cells were transiently transfected with different constructs as indicated. After serum starvation overnight, PDGFRβ (A) or FGFR1 (C) was immunoprecipitated (IP) and subjected to immunoblot analysis. The amount of transfected proteins in the cell lysates (CL) were also analyzed by immunoblotting. B, quantification of ERK phosphorylation and normalization were described under “Experimental Procedures.” The values were reported as the means ± S.D., and compared with the control (ANOVA test; n = 3). D, left panel, L6 myoblasts were analyzed for PDGFRα and PDGFRβ expression by immunoblotting. Right panel, L6 myoblasts were lysed, and the cell lysates were precleaned with glutathione-Sepharose alone before incubation with GST or GST-FRS2αPTB fusion proteins bound to glutathione-Sepharose. The precipitates were subjected to immunoblot analysis. The input of GST and GST-FRS2αPTB construct levels were the same as shown in Fig. 6C. All of the results are representative of three separate experiments.
FIGURE 8.
FIGURE 8.
Effects of FRS2 knockdown on growth factor-mediated down-regulation of smooth muscle marker gene expression. A, VSMC were treated with 25 μg/ml cycloheximide (CHX) for the indicated time points and analyzed for FRS2 and cyclin D1 expression by immunoblotting. β-Tubulin served as a loading control. B, PAC1 FRS2 knockdown and nontargeting control cells were analyzed for FRS2 expression by immunoblotting. The amount of FRS2 protein was quantified by ImageQuant software and normalized to β-tubulin. C and D, PAC1 cells were serum-starved overnight, treated with growth factors (20 ng/ml FGF2, 50 ng/ml PDGF-BB) or left untreated for 72 h, and analyzed for smooth muscle marker gene expression by immunoblotting. NC, nontargeting control. Quantification of SM α-actin and SM22α and normalization were described under “Experimental Procedures.” The values are reported as the means ± S.D. and compared with the control (ANOVA test; n = 3). *, p < 0.05.
FIGURE 9.
FIGURE 9.
Effects of FRS2 knockdown on PDGF-BB-mediated VSMC proliferation. A, PAC1 cells were serum-starved overnight and treated with 100 ng/ml PDGF-BB or left untreated for the indicated time points. The cell proliferation rate was determined using MTT assay. B, PAC1 cells were serum-starved overnight, stimulated with 100 ng/ml PDGF-BB for the indicated time points, and analyzed for ERK activation by immunoblot. The level of total ERK served as a loading control. C, BVSMC were transiently transfected with FRS2-HA construct. After serum starvation overnight, the cells were stimulated with growth factor (20 ng/ml FGF2, 50 ng/ml PDGF-BB) or left untreated for 24 h, following a 60-min pulse of BrdUrd labeling. BrdUrd was visualized by immunofluorescence staining and quantified by cell counting. *, p < 0.05, as compared with the nontransfected control cells treated with FGF2 (Student's t test). D, 293T cells were transiently transfected with different constructs as indicated. After serum starvation overnight, the cell lysates were prepared and subjected to Western blot analysis. The amount of transfected proteins in the cell lysates were also analyzed by immunoblotting. β-Tubulin served as a loading control. All of the results are representative of three separate experiments.

References

    1. Owens G. K. ( 2007) Novartis Found. Symp. 283, 174– 193 - PubMed
    1. Rzucidlo E. M., Martin K. A., Powell R. J. ( 2007) J. Vasc. Surg. 45, ( Suppl. A) 25– 32 - PubMed
    1. Millette E., Rauch B. H., Kenagy R. D., Daum G., Clowes A. W. ( 2006) Trends Cardiovasc. Med. 16, 25– 28 - PubMed
    1. Brogi E., Winkles J. A., Underwood R., Clinton S. K., Alberts G. F., Libby P. ( 1993) J. Clin. Investig. 92, 2408– 2418 - PMC - PubMed
    1. Lindner V. ( 1995) Z. Kardiol. 84, ( Suppl. 4) 137– 144 - PubMed

Publication types

MeSH terms

Substances