. 2009 Apr;132(Pt 4):999-1012.
doi: 10.1093/brain/awp028. Epub 2009 Apr 1.

Cortical and subcortical networks in human secondarily generalized tonic-clonic seizures

Affiliations

Cortical and subcortical networks in human secondarily generalized tonic-clonic seizures

H Blumenfeld et al. Brain. 2009 Apr.

Abstract

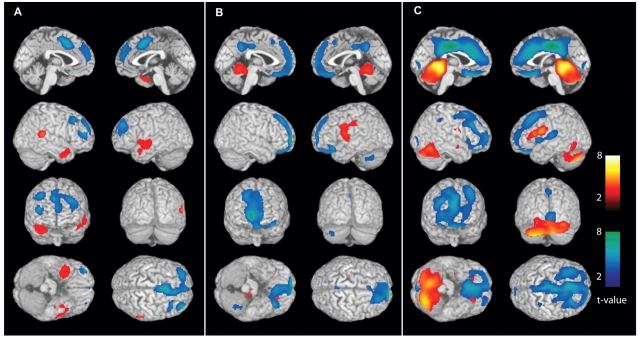
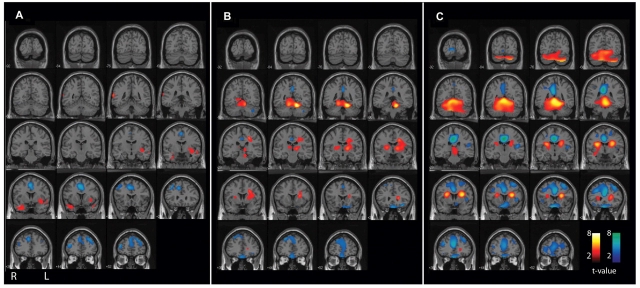
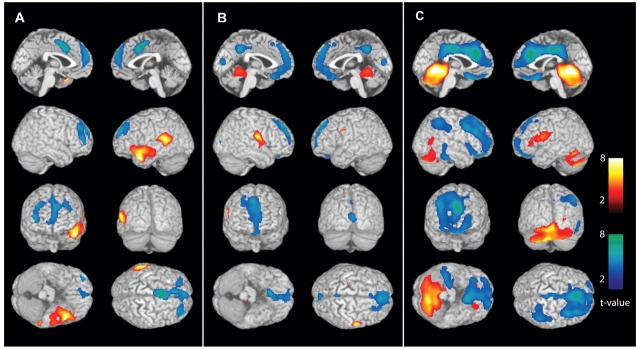
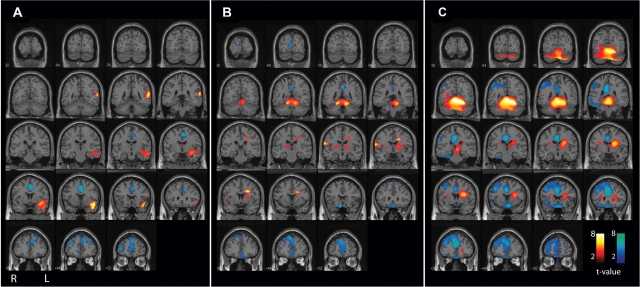
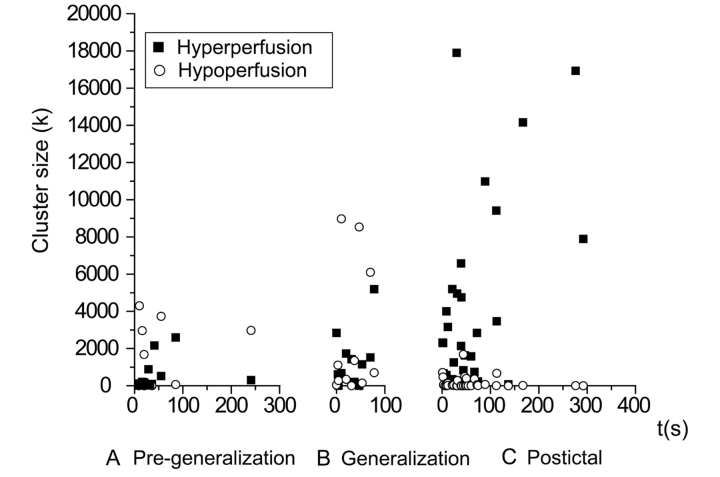
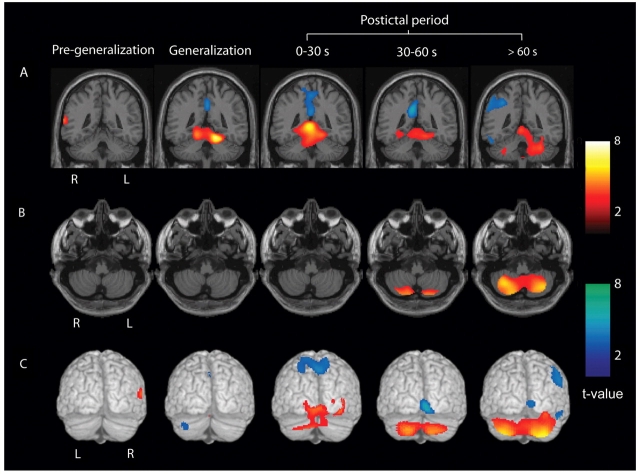
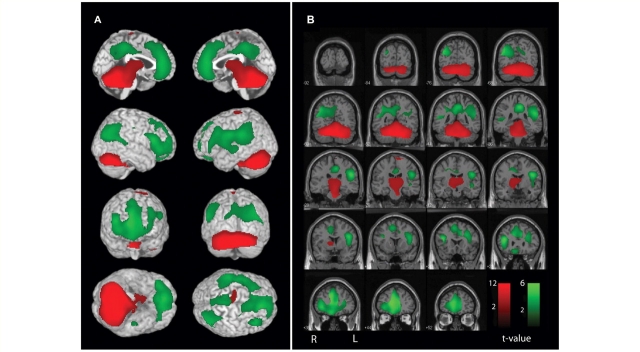
Generalized tonic-clonic seizures are among the most dramatic physiological events in the nervous system. The brain regions involved during partial seizures with secondary generalization have not been thoroughly investigated in humans. We used single photon emission computed tomography (SPECT) to image cerebral blood flow (CBF) changes in 59 secondarily generalized seizures from 53 patients. Images were analysed using statistical parametric mapping to detect cortical and subcortical regions most commonly affected in three different time periods: (i) during the partial seizure phase prior to generalization; (ii) during the generalization period; and (iii) post-ictally. We found that in the pre-generalization period, there were focal CBF increases in the temporal lobe on group analysis, reflecting the most common region of partial seizure onset. During generalization, individual patients had focal CBF increases in variable regions of the cerebral cortex. Group analysis during generalization revealed that the most consistent increase occurred in the superior medial cerebellum, thalamus and basal ganglia. Post-ictally, there was a marked progressive CBF increase in the cerebellum which spread to involve the bilateral lateral cerebellar hemispheres, as well as CBF increases in the midbrain and basal ganglia. CBF decreases were seen in the fronto-parietal association cortex, precuneus and cingulate gyrus during and following seizures, similar to the 'default mode' regions reported previously to show decreased activity in seizures and in normal behavioural tasks. Analysis of patient behaviour during and following seizures showed impaired consciousness at the time of SPECT tracer injections. Correlation analysis across patients demonstrated that cerebellar CBF increases were related to increases in the upper brainstem and thalamus, and to decreases in the fronto-parietal association cortex. These results reveal a network of cortical and subcortical structures that are most consistently involved in secondarily generalized tonic-clonic seizures. Abnormal increased activity in subcortical structures (cerebellum, basal ganglia, brainstem and thalamus), along with decreased activity in the association cortex may be crucial for motor manifestations and for impaired consciousness in tonic-clonic seizures. Understanding the networks involved in generalized tonic-clonic seizures can provide insights into mechanisms of behavioural changes, and may elucidate targets for improved therapies.


Figures

Figure 1
Figure 1
Secondarily generalized tonic–clonic seizures are associated with CBF changes in cortical and subcortical networks. Data from L-R combined analyses are shown (see ‘Methods’ section). Statistical parametric maps depict CBF increases (warm colours) and decreases (cool colours) compared with baseline interictal images. (A) Pre-generalization period (n = 12). Increases in the temporal lobes (the most common region of seizure onset) do not reach statistical significance at the cluster level, while significant decreases occur in the cingulate gyrus and frontal association cortex. (B) Generalization period (n = 12). Significant increases at the cluster level occur in the superior medial cerebellum, left thalamus and basal ganglia, while significant decreases occur in the frontal association cortex. Note that thalamic and basal ganglia increases are not visible in these surface renderings (see Fig. 2B for subcortical changes) except for where they artifactually appear on the lateral surface in the second row, right image (left lateral brain view). In fact, no significant cortical increases occur in the group analysis during the generalization period (Fig. 2B, Table 1). (C) post-ictal period (n = 35). Significant increases occur in the cerebellum and dorsal midbrain, while decreases occur in the frontal association cortex, cingulate and precuneus. As in the generalization period, no significant cortical increases occur, but some of the basal ganglia signal appears on the lateral surface due to the surface rendering algorithm. For A–C, extent threshold, k = 125 voxels (voxel size = 2 × 2 × 2 mm3). Height threshold, P = 0.01. Equivalently, only voxel clusters greater than 1 cm3 in volume and with Z scores greater than 2.33 are displayed. Only regions with corrected P < 0.05 are considered significant at the cluster level (Table 1).
Figure 2
Figure 2
CBF changes associated with secondarily generalized tonic–clonic seizures (L-R combined analysis), with results overlaid on a structural MRI in the coronal plane. Same patients and data are shown as in Fig. 1. Statistical parametric maps depict CBF increases (warm colours) and decreases (cool colours) compared with baseline interictal images. (A) Pre-generalization period (n = 12). Increases in the temporal lobes (the most common region of seizure onset) do not reach cluster-level significance (Table 1), while significant decreases occur in the cingulate gyrus and frontal association cortex. (B) Generalization period (n = 12). Significant increases at the cluster level occur in the superior medial cerebellum, left thalamus and basal ganglia, while significant decreases occur in the frontal association cortex. (C) post-ictal period (n = 35). Significant increases occur in the cerebellum and midbrain, while decreases occur in the frontal association cortex, cingulate and precuneus. Increases in basal ganglia and adjacent white matter do not reach cluster-level significance. For AC, extent threshold, k = 125 voxels (voxel size = 2 × 2 × 2 mm3). Height threshold, P = 0.01. Equivalently, only voxel clusters greater than 1 cm3 in volume and with Z scores greater than 2.33 are displayed. Only regions with corrected P < 0.05 are considered significant at the cluster level (Table 1).
Figure 3
Figure 3
CBF changes ipsi- and contralateral to side of seizure onset in secondarily generalized tonic–clonic seizures (lateralized analysis). Changes ipsilateral to seizure onset are shown on the left side of the brain rendering, and contralateral changes on the right side of the brain (combining patients with left- and right-onset seizures). CBF increases (warm colours) and decreases (cool colours) were analysed compared with baseline interictal images. (A) Pre-generalization period (n = 9). Significant increases occur in the ipsilateral temporal lobe (the most common region of seizure onset), while decreases occur in the bilateral cingulate gyrus and frontal association cortex. (B) Generalization period (n = 10). Significant increases occur in the bilateral superior medial cerebellum. Increases seen in thalamus, basal ganglia and contralateral Rolandic cortex did not reach significance at the cluster level. Significant decreases occur in the bilateral frontal association cortex (slightly more pronounced contralateral). (C) post-ictal period (n = 24). Significant increases occur in the bilateral cerebellum, midbrain and ipsilateral basal ganglia, while decreases occur in the bilateral frontal association cortex (more pronounced contralateral), bilateral cingulate and precuneus, and in the contralateral lateral parietal cortex. No significant cortical increases occur post-ictally, but some of the basal ganglia signal appears on the lateral surface (second row of images) due to the surface rendering algorithm. For A–C, extent threshold, k = 125 voxels (voxel size = 2 × 2 × 2 mm3). Height threshold, P = 0.01. Equivalently, only voxel clusters greater than 1 cm3 in volume and with Z scores greater than 2.33 are displayed. Only regions with corrected P < 0.05 are considered significant at the cluster level (Table 2).
Figure 4
Figure 4
CBF changes ipsi- and contralateral to side of seizure onset (lateralized analysis) overlaid on a structural MRI in the coronal plane. Same patients and data are shown as in Fig. 3. Changes ipsilateral to seizure onset are shown on the left side of the brain sections, and contralateral changes on the right side (combining patients with left- and right-onset seizures). CBF increases (warm colours) and decreases (cool colours) were analysed compared with baseline interictal images. (A) Pre-generalization period (n = 9). Significant increases occur in the ipsilateral temporal lobes (the most common region of seizure onset), while decreases occur in the bilateral cingulate gyrus and anterior medial frontal association cortex. (B) Generalization period (n = 10). Significant increases occur in the bilateral superior medial cerebellum. Increases seen in thalamus, basal ganglia and contralateral Rolandic cortex did not reach significance at the cluster level. Significant decreases occur in the bilateral frontal association cortex (slightly more pronounced contralateral). (C) Post-ictal period (n = 24). Significant increases occur in the bilateral cerebellum, midbrain, ipsilateral basal ganglia and adjacent white matter, while decreases occur in the bilateral frontal association cortex (more pronounced contralateral), bilateral cingulate and precuneus, and in the contralateral lateral parietal cortex. For AC, extent threshold, k = 125 voxels (voxel size = 2 × 2 × 2 mm3). Height threshold, P = 0.01. Equivalently, only voxel clusters >1 cm3 in volume and with Z-scores greater than 2.33 are displayed. Only regions with corrected P < 0.05 are considered significant at the cluster level (Table 2).
Figure 5
Figure 5
Cerebellum shows progressive CBF increases in the post-ictal period following secondarily generalized tonic–clonic seizures. Total number of cerebellar voxels with significant CBF increases (filled square) or decreases (open circle) in individual patients are plotted against SPECT injection time. (A) Pre-generalization (n = 12). (B) Generalization (n = 12). (C) Post-ictal (n = 35). Time = 0 in each case is the beginning of the pre-generalization, generalization or post-ictal epochs. Patients were the same as in Fig. 1 and 2. Analysis was performed using the small volume correction in SPM to identify significant SPECT changes in the cerebellum of individual patients at a voxel-level significance threshold P = 0.01, and cluster-extent threshold k = 125 (see ‘Methods’ section for details).
Figure 6
Figure 6
Evolution of cerebellar CBF increases from the superior medial cerebellum to the lateral cerebellar hemispheres. Statistical parametric maps depict CBF increases (warm colours) and decreases (cool colours) compared with baseline interictal images. (A) CBF increases and decreases overlaid on a structural MRI in the coronal plane demonstrates superior medial cerebellar increases peaking during the generalization and early post-ictal (0–30 s) periods. (B) Axial sections through the inferior cerebellum demonstrating lateral cerebellar increases most prominent at late post-ictal times (>60 s). (C) Posterior surface renderings demonstrating medial to lateral evolution of cerebellar CBF increases during the post-ictal period. (A–C) Group analyses were performed for SPECT injections during the pre-generalization (n = 12), generalization (n = 12), early post-ictal (0–30 s, n = 12), middle post-ictal (30–60 s, n = 13) and late post-ictal (>60 s, n = 10) periods. Patients were the same as in Fig. 1 and 2. SPM extent threshold, k = 125 voxels (voxel size = 2 × 2 × 2 mm3). Height threshold, P = 0.01.
Figure 7
Figure 7
Network correlations between cerebellar CBF changes and other brain regions. Positive (red) and negative (green) correlations are shown. SPM analysis was used to correlate SPECT changes in the cerebellum with all voxels in the brain across patients (n = 59). (A) Surface rendering. (B) Coronal sections. Significant positive correlations with cerebellar CBF changes were found in the upper brainstem tegmentum and thalamus. Negative correlations were found with the bilateral fronto-parietal association cortex, anterior and posterior cingulate and precuneus. Patients were the same as in Fig. 1 and 2. SPM extent threshold, k = 125 voxels (voxel size = 2 × 2 × 2 mm3). Height threshold, P = 0.01.

References

    1. Aghakhani Y, Bagshaw AP, Benar CG, Hawco C, Andermann F, Dubeau F, et al. fMRI activation during spike and wave discharges in idiopathic generalized epilepsy. Brain. 2004;127:1127–44. - PubMed
    1. Andersen AR. 99mTc-D,L-hexamethylene-propyleneamine oxime (99mTc-HMPAO): basic kinetic studies of a tracer of cerebral blood flow. Cerebrovasc Brain Metab Rev. 1989;1:288–318. - PubMed
    1. Archer JS, Abbott DF, Waites AB, Jackson GD. fMRI 'deactivation' of the posterior cingulate during generalized spike and wave. Neuroimage. 2003;20:1915–22. - PubMed
    1. Avoli M, Gloor P, Kostopoulos G, Naquet T, editors. Generalized epilepsy. Boston: Birkhauser; 1990.
    1. Bell WL, Walczak TS, Shin C, Radtke RA. Painful generalised clonic and tonic–clonic seizures with retained consciousness. J Neurol Neurosurg Psych. 1997;63:792–5. - PMC - PubMed

Publication types

MeSH terms