. 2009 May;132(Pt 5):1175-89.
doi: 10.1093/brain/awp070. Epub 2009 Mar 31.

The relation between inflammation and neurodegeneration in multiple sclerosis brains

Affiliations

The relation between inflammation and neurodegeneration in multiple sclerosis brains

Josa M Frischer et al. Brain. 2009 May.

Abstract

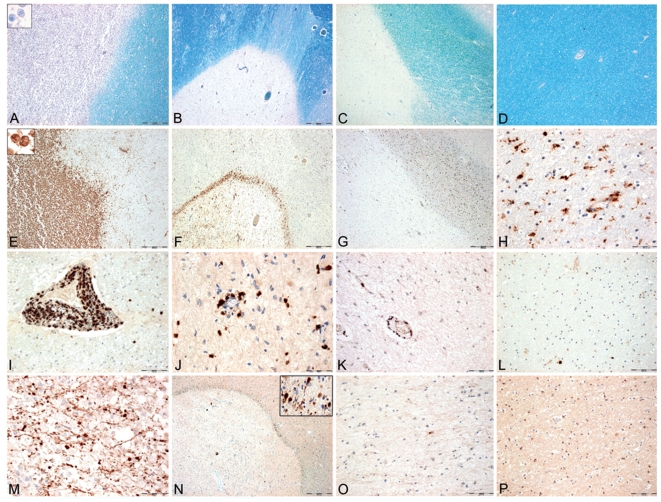
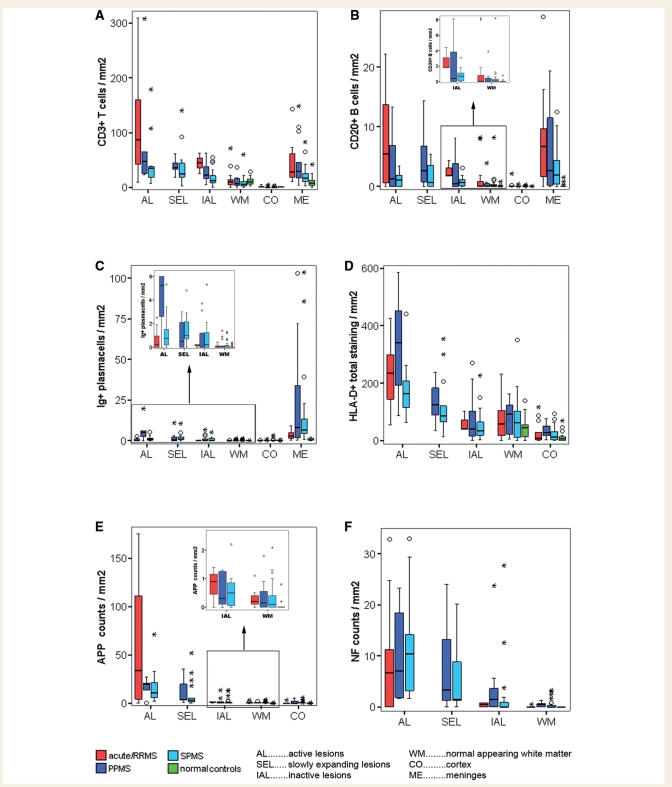
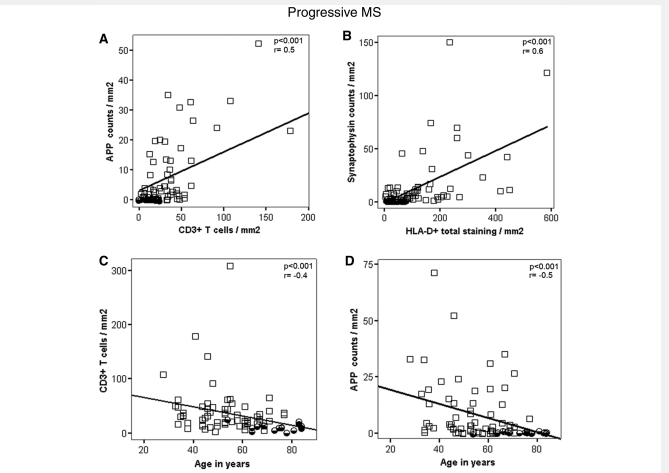
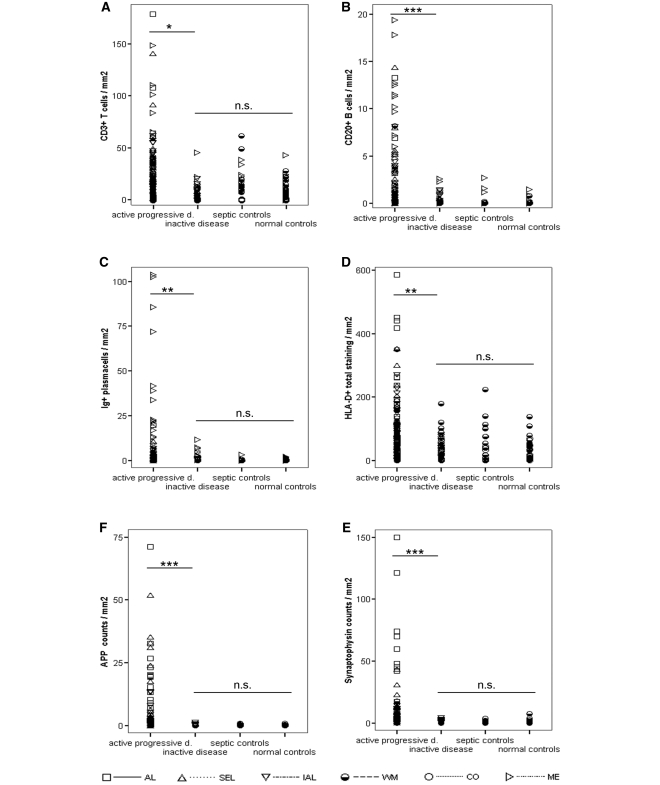
Some recent studies suggest that in progressive multiple sclerosis, neurodegeneration may occur independently from inflammation. The aim of our study was to analyse the interdependence of inflammation, neurodegeneration and disease progression in various multiple sclerosis stages in relation to lesional activity and clinical course, with a particular focus on progressive multiple sclerosis. The study is based on detailed quantification of different inflammatory cells in relation to axonal injury in 67 multiple sclerosis autopsies from different disease stages and 28 controls without neurological disease or brain lesions. We found that pronounced inflammation in the brain is not only present in acute and relapsing multiple sclerosis but also in the secondary and primary progressive disease. T- and B-cell infiltrates correlated with the activity of demyelinating lesions, while plasma cell infiltrates were most pronounced in patients with secondary progressive multiple sclerosis (SPMS) and primary progressive multiple sclerosis (PPMS) and even persisted, when T- and B-cell infiltrates declined to levels seen in age matched controls. A highly significant association between inflammation and axonal injury was seen in the global multiple sclerosis population as well as in progressive multiple sclerosis alone. In older patients (median 76 years) with long-disease duration (median 372 months), inflammatory infiltrates declined to levels similar to those found in age-matched controls and the extent of axonal injury, too, was comparable with that in age-matched controls. Ongoing neurodegeneration in these patients, which exceeded the extent found in normal controls, could be attributed to confounding pathologies such as Alzheimer's or vascular disease. Our study suggests a close association between inflammation and neurodegeneration in all lesions and disease stages of multiple sclerosis. It further indicates that the disease processes of multiple sclerosis may die out in aged patients with long-standing disease.


Figures

Figure 1
Figure 1
Inflammation, demyelination and axonal injury in different multiple sclerosis lesions and the normal appearing white matter. (A, E, I and M) Panels show an active lesion from a patient with acute multiple sclerosis with active demyelination (A), profound macrophage (E) and T-cell infiltration (I) and extensive acute axonal injury (M), visualized with APP. (B, F, J and N): Panels show a slowly expanding lesion from a patient with pathologically active progressive multiple sclerosis (SPMS), with focal demyelination (B), a small but dense rim of CD 68 positive macrophages and microglia at the edge (F). Some of them contain early myelin degradation products. There is T-cell infiltration within the lesion (J) and profound acute axonal injury at the lesion's edge (N and insert). (C, G, K and O) Panels show an inactive lesion from a patient with pathologically active progressive multiple sclerosis (SPMS; i.e. presence of active or slowly expanding lesions at other locations). The focal demyelination is sharply demarcated from the surrounding NAWM (C). Some CD68 positive macrophages or microglia cells (G), mild tissue infiltration with T cells (K) and some APP positive axonal profiles (O) are seen within the inactive lesion. (D, H, L and P) Panels show the NAWM from a case with acute multiple sclerosis. There is no demyelination (D). Some CD68 positive microglia cells (H), few infiltrating T cells (L) and no APP positive axons are present (P). (AD) Luxol fast blue myelin staining with PAS reaction (AD ×13) (EH) Immunohistochemistry for CD 68 (E–G ×13, H ×130) (IL) Immunohistochemistry for CD3 (I, K, L ×65 and J ×130) (MP): Immunohistochemistry for APP (M ×130, N ×13, insert ×130, O, P ×65).
Figure 2
Figure 2
Density of inflammatory infiltrates and axonal injury in relation to lesional activity and disease course. Graphs display densities of T cells (A), B cells (B), plasma cells (C), microglia/macrophages (D) as well as APP positive (E) and neurofilament positive axonal injury (F) in different lesion types, NAWM, meninges and cortex separated for the three main disease courses: acute–relapsing multiple sclerosis, SPMS and PPMS. Values of normal control white matter, cortex and meninges are additionally shown. The graph depicts the density of inflammatory infiltrates and axonal injury in relation to lesional activity and disease course. Inserts show the densities of inflammatory infiltrates in inactive lesions and the NAWM in more detail. Box plots represent median value (50th percentile) and range of lesional densities. Outliers (values that are between 1.5 and 3 times the interquartile range) are marked with a circle. Extreme values (values that are more than three times the interquartile range) are marked with an asterisk. Values are mean values for each present lesion type or area per patient. The densities of T-cells and microglia/macrophages are highest in active lesions, followed by slowly expanding lesions and inactive lesions (A and D). B-cell infiltration is mainly seen in active lesions and meninges followed by slowly expanding lesions (B), while plasma cells are predominantly found in meninges (C). Equally, axonal injury (E and F) is mainly seen in active lesions and slowly expanding lesions. Active lesions and slowly expanding lesions separated for acute–relapsing, SPMS or PPMS cases all display significantly higher levels compared to normal control WM for all inflammatory and neurodegenerative markers (AF). Meningeal infiltrates of T cells (A), B cells (B) and plasma cells (C) in acute–relapsing, SPMS and PPMS cases equally display significantly higher levels than pooled control meninges. The same situation applies when inflammatory infiltrates and axonal injury of active lesions and slowly expanding lesions or meningeal inflammatory infiltrates, separated for acute–relapsing, SPMS and PPMS, are compared to pooled control WM (with septic controls). Inactive lesions in acute–relapsing multiple sclerosis cases display significantly higher T cell (A) and B cell (B insert) infiltrates and significantly more APP positive (E) and NF-M positive (F) axonal injury compared to normal control white matter. Inactive lesions in PPMS and SPMS cases show a heterogeneous pattern of differences compared to normal or pooled controls (see Results section and separation of SPMS and PPMS cases into the categories of pathologically active progressive and pathologically inactive). We do not observe significant differences between SPMS and PPMS cases. (F) In order to simplify graphical presentation three acute–relapsing multiple sclerosis active lesional extreme values have been cut.
Figure 3
Figure 3
(A and B) Graphs show examples of the interdependence of inflammation and neurodegeneration among progressive multiple sclerosis patients (SPMS and PPMS). Multiple sclerosis values represent lesional mean values for all lesion types per patient. We observe highly significant positive correlations between acute axonal injuries and inflammatory infiltrates (A and B) among progressive multiple sclerosis patients. We also find those correlations when analysed in all multiple sclerosis cases (acute–relapsing, SPMS and PPMS) (see Results section). (C and D) Graphs express examples of the relation between age and densities of inflammatory infiltrates (C) or axonal injury (D) in progressive multiple sclerosis (SPMS and PPMS) lesions. Multiple sclerosis values represent lesional values for all lesion types per patient. We find highly significant negative correlations between inflammation and age at death (C) and age at death and axonal injury (D) among progressive multiple sclerosis patients. Those negative correlations also persist when analysed in all multiple sclerosis patients (see Results section). For more detailed information see Supplementary Table 2.
Figure 4
Figure 4
The graph displays the differences between pathologically active progressive multiple sclerosis, pathologically inactive multiple sclerosis and controls (normal and septic controls). Among pooled progressive multiple sclerosis (SPMS and PPMS) patients, we have identified two distinct pathological subgroups: Pathologically active progressive multiple sclerosis cases had active lesions or slowly expanding lesions in white matter or cortex. Pathologically inactive multiple sclerosis cases only had inactive lesions in white matter and cortex. Apart from significant differences in their clinical presentation (Table 1), those entities also differ in their pathological presentation. Overall, pathologically active progressive disease cases display significantly higher densities of inflammatory infiltrates (AD) and axonal injury (E and F) than pathologically inactive disease cases. Importantly, these differences remained when analysing inactive lesions or NAWM only (see Supplementary Table 3). In addition, pathologically active progressive disease cases also display significantly higher densities of inflammatory infiltrates (AD) and axonal injury (E and F) than pooled controls. These differences were consistent using pooled data or values from either inactive lesions or NAWM only (the latter two not shown). Remarkably, even when using pooled data, both inflammatory infiltrates (A, C and D) and axonal injury (E and F) of pathologically inactive disease cases were in the range of normal or pooled control values. Areas of confounding pathology are not included. Multiple sclerosis values are lesional, normal appearing white matter, cortical and meningeal densities of inflammatory infiltrates (AD) and lesional, NAWM and cortical densities of axonal injury (E and F). Control values are white matter, cortical and meningeal densities of inflammatory infiltrates (AD) and white matter and cortical densities of axonal injury (E and F). Differences between pathologically active progressive, pathologically inactive disease and pooled controls have been assessed with Mann–Whitney U-tests by pooling all values (lesional, white matter, cortical and meningeal values). P-values are corrected with Shaffer's procedure. AL = active lesions; SEL = slowly expanding lesions; IAL = inactive lesions; WM, white matter; CO, cortex; ME, meninges; NS = not significant; *P < 0.05; **P < 0.01; ***P < 0.001.
Figure 5
Figure 5
Additional CNS pathologies in multiple sclerosis patients with pathologically inactive disease. In the brains of patients with late stage inactive multiple sclerosis, different additional pathologies are observed: (A) Staining for phosphorylated neurofilament (SMI312, ×140) revealed unusually thick demyelinated axons in inactive plaques. Clusters of synaptophysin reactivity (B and C ×70) are located periventricularly (B) and perivascularly (C) within inactive lesions with severe axonal loss. In a patient with concomitant vascular pathology, axonal tract degeneration is visualized by APP staining (D ×70). Since Alzheimer's disease was most frequent in pathologically inactive disease patients, we compared the extent of axonal injury in cortex (E) and NAWM (F and G) of inactive multiple sclerosis patients (n = 12) with and without concomitant Alzheimer's disease. The graphs express the density of axons positive for APP (E and F) or phosphorylated neurofilament (SMI312, G). Values represent cortical mean values and NAWM mean values per patient. Box plots represent median value (50th percentile) and range. Extreme values (values that are more than three times the interquartile range) are marked with an asterisk. Those patients with concomitant Alzheimer's disease pathology (n = 5) show significantly more cortical neurodegeneration (E) than those without (n = 7). In the NAWM patients with concomitant Alzheimer's disease pathology show significantly more chronic axonal injury (G) but only a trend to more acute axonal injury (F).

References

    1. Anderson VM, Fox NC, Miller DH. Magnetic resonance imaging measures of brain atrophy in multiple sclerosis. J Magn Reson Imaging. 2006;23:605–18. - PubMed
    1. Babbe H, Roers A, Waisman A, Lassmann H, Goebels N, Hohlfeld R, et al. Clonal expansions of CD8(+) T cells dominate the T cell infiltrate in active multiple sclerosis lesions as shown by micromanipulation and single cell polymerase chain reaction. J Exp Med. 2000;192:393–404. - PMC - PubMed
    1. Bauer J, Elger CE, Hans VH, Schramm J, Urbach H, Lassmann H, et al. Astrocytes are a specific immunological target in Rasmussen's encephalitis. Ann Neurol. 2007;62:67–80. - PubMed
    1. Bergers E, Bot JC, De Groot CJ, Polman CH, Nijeholt GJ, Castelijns JA, et al. Axonal damage in the spinal cord of MS patients occurs largely independent of T2 MRI lesions. Neurology. 2002;59:1766–71. - PubMed
    1. Bielekova B, Kadom N, Fisher E, Jeffries N, Ohayon J, Richert N, et al. MRI as a marker for disease heterogeneity in multiple sclerosis. Neurology. 2005;65:1071–6. - PubMed

Publication types

MeSH terms