

The global signal and observed anticorrelated resting state brain networks
- PMID: 19339462
- PMCID: PMC2694109
- DOI: 10.1152/jn.90777.2008
The global signal and observed anticorrelated resting state brain networks
Abstract
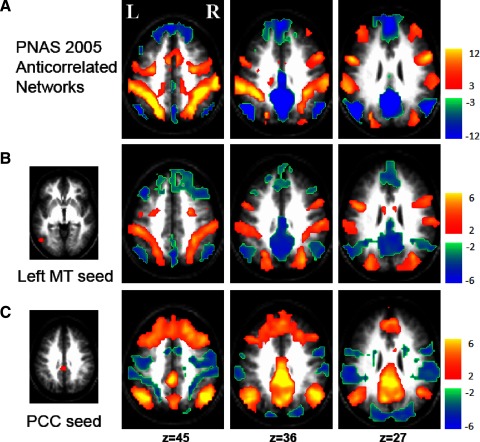
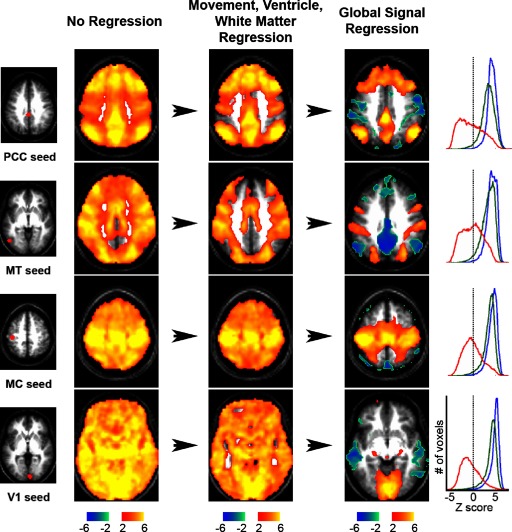
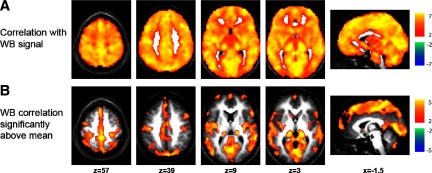
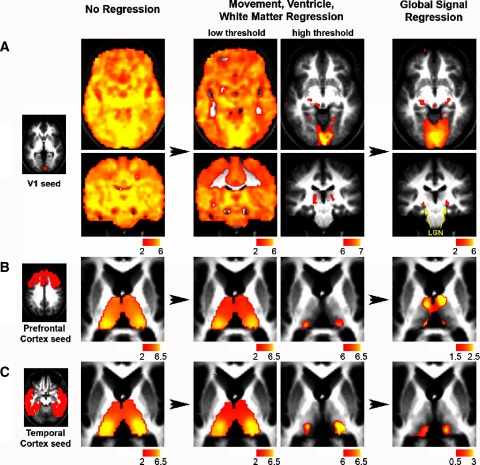
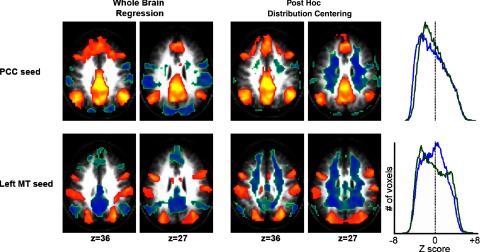
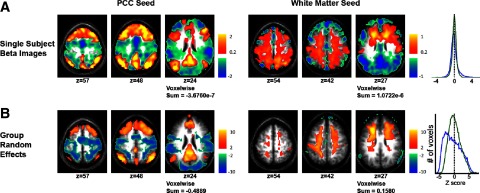
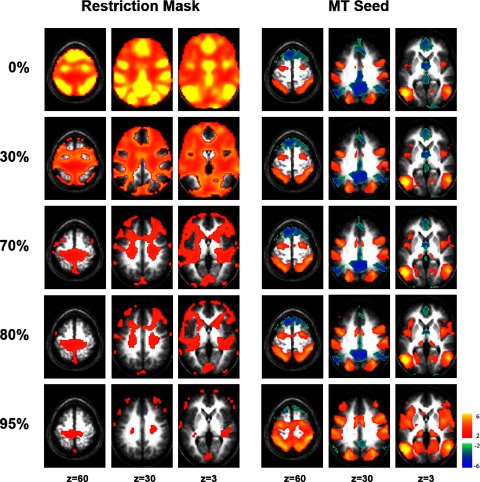
Resting state studies of spontaneous fluctuations in the functional MRI (fMRI) blood oxygen level dependent (BOLD) signal have shown great promise in mapping the brain's intrinsic, large-scale functional architecture. An important data preprocessing step used to enhance the quality of these observations has been removal of spontaneous BOLD fluctuations common to the whole brain (the so-called global signal). One reproducible consequence of global signal removal has been the finding that spontaneous BOLD fluctuations in the default mode network and an extended dorsal attention system are consistently anticorrelated, a relationship that these two systems exhibit during task performance. The dependence of these resting-state anticorrelations on global signal removal has raised important questions regarding the nature of the global signal, the validity of global signal removal, and the appropriate interpretation of observed anticorrelated brain networks. In this study, we investigate several properties of the global signal and find that it is, indeed, global, not residing preferentially in systems exhibiting anticorrelations. We detail the influence of global signal removal on resting state correlation maps both mathematically and empirically, showing an enhancement in detection of system-specific correlations and improvement in the correspondence between resting-state correlations and anatomy. Finally, we show that several characteristics of anticorrelated networks including their spatial distribution, cross-subject consistency, presence with modified whole brain masks, and existence before global regression are not attributable to global signal removal and therefore suggest a biological basis.
Figures
Similar articles
-
Hubs of Anticorrelation in High-Resolution Resting-State Functional Connectivity Network Architecture.Brain Connect. 2015 Jun;5(5):267-75. doi: 10.1089/brain.2014.0323. Epub 2015 Mar 24. Brain Connect. 2015. PMID: 25744222
-
Anticorrelations in resting state networks without global signal regression.Neuroimage. 2012 Jan 16;59(2):1420-8. doi: 10.1016/j.neuroimage.2011.08.048. Epub 2011 Aug 26. Neuroimage. 2012. PMID: 21889994 Free PMC article.
-
Correlations and anticorrelations in resting-state functional connectivity MRI: a quantitative comparison of preprocessing strategies.Neuroimage. 2009 Oct 1;47(4):1408-16. doi: 10.1016/j.neuroimage.2009.05.005. Epub 2009 May 13. Neuroimage. 2009. PMID: 19442749
-
Mapping cognitive and emotional networks in neurosurgical patients using resting-state functional magnetic resonance imaging.Neurosurg Focus. 2020 Feb 1;48(2):E9. doi: 10.3171/2019.11.FOCUS19773. Neurosurg Focus. 2020. PMID: 32006946 Free PMC article. Review.
-
Functional connectomics from resting-state fMRI.Trends Cogn Sci. 2013 Dec;17(12):666-82. doi: 10.1016/j.tics.2013.09.016. Epub 2013 Nov 12. Trends Cogn Sci. 2013. PMID: 24238796 Free PMC article. Review.
Cited by
-
Converging Resting State Networks Unravels Potential Remote Effects of Transcranial Magnetic Stimulation for Major Depression.Front Psychiatry. 2020 Aug 20;11:836. doi: 10.3389/fpsyt.2020.00836. eCollection 2020. Front Psychiatry. 2020. PMID: 32973580 Free PMC article.
-
Dynamic Language Network in Early and Late Cantonese-Mandarin Bilinguals.Front Psychol. 2020 Jun 18;11:1189. doi: 10.3389/fpsyg.2020.01189. eCollection 2020. Front Psychol. 2020. PMID: 32625136 Free PMC article.
-
Association between Long-Term Air Pollution, Chronic Traffic Noise, and Resting-State Functional Connectivity in the 1000BRAINS Study.Environ Health Perspect. 2022 Sep;130(9):97007. doi: 10.1289/EHP9737. Epub 2022 Sep 26. Environ Health Perspect. 2022. PMID: 36154234 Free PMC article.
-
Estimation of resting-state functional connectivity using random subspace based partial correlation: a novel method for reducing global artifacts.Neuroimage. 2013 Nov 15;82:87-100. doi: 10.1016/j.neuroimage.2013.05.118. Epub 2013 Jun 5. Neuroimage. 2013. PMID: 23747287 Free PMC article.
-
The Differences in the Whole-Brain Functional Network between Cantonese-Mandarin Bilinguals and Mandarin Monolinguals.Brain Sci. 2021 Mar 2;11(3):310. doi: 10.3390/brainsci11030310. Brain Sci. 2021. PMID: 33801390 Free PMC article.
References
-
- Aguirre GK, Zarahn E, D'Esposito M. The inferential impact of global signal covariates in functional neuroimaging analyses. Neuroimage 8: 302–306, 1998. - PubMed
-
- Andersson JL How to estimate global activity independent of changes in local activity. Neuroimage 6: 237–244, 1997. - PubMed
-
- Bartels A, Zeki S. The chronoarchitecture of the human brain - natural viewing conditions reveal a time-based anatomy of the brain. Neuroimage 22: 419–433, 2004. - PubMed
-
- Birn RM, Diamond JB, Smith MA, Bandettini PA. Separating respiratory-variation-related fluctuations from neuronal-activity-related fluctuations in fMRI. Neuroimage 31: 1536–1548, 2006. - PubMed
Publication types
MeSH terms
Substances
Grants and funding
LinkOut - more resources
Full Text Sources
Other Literature Sources
Molecular Biology Databases