. 2009 Apr 1;29(13):3974-80.
doi: 10.1523/JNEUROSCI.4363-08.2009.

Resting microglia directly monitor the functional state of synapses in vivo and determine the fate of ischemic terminals

Affiliations

Resting microglia directly monitor the functional state of synapses in vivo and determine the fate of ischemic terminals

Hiroaki Wake et al. J Neurosci. .

Abstract

Recent studies have identified the important contribution of glial cells to the plasticity of neuronal circuits. Resting microglia, the primary immune effector cells in the brain, dynamically extend and retract their processes as if actively surveying the microenvironment. However, just what is being sampled by these resting microglial processes has not been demonstrated in vivo, and the nature and function of any interactions between microglia and neuronal circuits is incompletely understood. Using in vivo two-photon imaging of fluorescent-labeled neurons and microglia, we demonstrate that the resting microglial processes make brief (approximately 5 min) and direct contacts with neuronal synapses at a frequency of about once per hour. These contacts are activity-dependent, being reduced in frequency by reductions in neuronal activity. After transient cerebral ischemia, the duration of these microglia-synapse contacts are markedly prolonged (approximately 1 h) and are frequently followed by the disappearance of the presynaptic bouton. Our results demonstrate that at least part of the dynamic motility of resting microglial processes in vivo is directed toward synapses and propose that microglia vigilantly monitor and respond to the functional status of synapses. Furthermore, the striking finding that some synapses in the ischemic areas disappear after prolonged microglial contact suggests microglia contribute to the subsequent increased turnover of synaptic connections. Further understanding of the mechanisms involved in the microglial detection of the functional state of synapses, and of their role in remodeling neuronal circuits disrupted by ischemia, may lead to novel therapies for treating brain injury that target microglia.


Figures
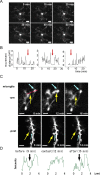
Figure 1.
Figure 1.
Dynamic motility of resting microglial processes and connection with synapses. A, Images of a single resting microglial cell in the intact cortex of an Iba1–EGFP mouse. Each is a stack image composed of 70–80 focal planes, each advancing 0.5 μm along the z-axis. Scale bar, 20 μm. Resting microglia have extensive processes which extend in all directions. These processes are dynamic, moving back and forth. B, Continuous monitoring of the motility of three representative microglial processes (from 3 different cells) using free-scanning imaging over 20 min. The absolute position of each process was expressed relative to a fixed starting point and summed into 12 s bins. Note a brief (∼4–5 min) pause, indicated by the red arrows, in process motility. C, Contacts between microglial processes (yellow arrow in each image) and a presynaptic bouton (blue arrows in top row) and a postsynaptic spine (blue arrow in bottom row). Images in each row (-pre, -post) were obtained from single-plane free-scanning images at a higher resolution (scale bars: -pre, 2 μm; -post, 4 μm) (see supplemental Videos 1-Presynapse and 2-Postsynapse, available at www.jneurosci.org as supplemental material). Note that the tip of the microglial process is enlarged during the contact. Left, middle, and right panels in each row were obtained before, during, and after the contact of the microglial process with the synaptic structure, respectively. D, Plots of fluorescence intensity as a function of distance along a straight line between a bouton and adjacent microglial process, indicated by the red broken line in C, -pre, left. The fluorescent intensity plot before contact (left) has two peaks, the left peak associated with the microglial process and the right with the presynaptic bouton. A region of minimum intensity, an intensity trough, is indicated by the black arrow and signifies a clear separation between the two structures. As the microglial process and the bouton came into contact, there was a loss of this fluorescence intensity trough (center). After the 5 min contact, the fluorescence intensity trough reappeared (right).
Figure 2.
Figure 2.
Direct and specific connection between microglia and synapses. A, Specific contacts between microglial processes (yellow arrow in each image), with postsynaptic dendritic spines (blue arrows in each image) along a single dendrite. The blue arrows indicating the spines are shown as solid arrows when contacted by the microglial process and as broken arrows when not in contact. Images were obtained from five planes of the z-axis of free-scanning images (scale bar, 2 μm). B, Electron microscopic pictures of cortical slices obtained from control brains (left) and ischemic brains (right), illustrating the direct contact between presynaptic (pre)/postsynaptic (post) elements and adjacent microglial processes (m). After ischemia, the contacts appear more extensive. Scale bar, 200 nm.
Figure 3.
Figure 3.
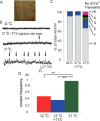
Decrease in neuronal activity reduces the contact frequency between microglia and synapses. A, In vivo image of Ca2+ fluorescence in visual cortex neurons (green staining) and astrocytes (yellow staining) in cortical neurons loaded with Oregon green BAPTA-AM 1 and sulforhodamine 101 under control conditions (37°C). B, Ca2+ transients (arrows), where absolute fluorescence exceeded the baseline Ca2+ fluorescence by >5%, in three different visual cortex neurons (green staining in A) from the same animal during a reduction in body temperature to 32°C (top trace), after TTX injection into the retina (center trace) and under control conditions (37°C; bottom trace). C, Quantification of the number of neurons under the three conditions, in which 0–5 or more of Ca2+ spikes were observed during a 30 min imaging. Sampling of neurons in each condition was performed at the same plane of imaging in the same mouse (n = 5). D, Averaged number of connections per hour between microglia and presynaptic structures in neurons under the three experimental conditions described in A. These experiments used thin-skull transcranial imaging in mice that were different from those used for the Ca2+ imaging. Asterisks indicate significant differences between control (p < 0.05).
Figure 4.
Figure 4.
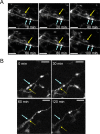
Prolongation of contacts between microglia processes and presynaptic boutons in response to cerebral ischemia and sequential loss of presynaptic bouton. A, z-stacked images of microglial processes (yellow arrow) and presynaptic boutons (blue arrows). Continuous images were acquired from the ischemic penumbra ∼500 μm apart from the ischemic core and commenced ∼30 min after MCA occlusion. Note that the contact between the microglial processes and the boutons lasted for >60 min, whereas it is very constant in duration about 5 min in the control brain (see text). In addition, the bulbous nature of the tip of the microglial processes once in contact with the pre(post)synaptic structures in the control (Fig. 1 B) were not evident in the ischemic brains. Top left image shows a microglial process before contact, indicated as 0 min, and bottom right shows the same process just after retraction. Scale bars, 5 μm. B, The presynaptic bouton (indicated by the blue arrow) in the ischemic penumbra disappeared after the prolonged contact with a microglial process (yellow arrow). Note that the microglial process in this example crept forward and backward along the axon (top two panels) and gradually approached one of boutons (lower left bouton, blue arrow). Scale bars, 2 μm.

References

    1. Bessis A, Béchade C, Bernard D, Roumier A. Microglial control of neuronal death and synaptic properties. Glia. 2007;55:233–238. - PubMed
    1. Biber K, Neumann H, Inoue K, Boddeke HW. Neuronal ‘On’ and ‘Off’ signals control microglia. Trends Neurosci. 2007;30:596–602. - PubMed
    1. Blinzinger K, Kreutzberg G. Displacement of synaptic terminals from regenerating motoneurons by microglial cells. Z Zellforsch Mikrosk Anat. 1968;85:145–157. - PubMed
    1. Bruce-Keller AJ. Microglial-neuronal interactions in synaptic damage and recovery. J Neurosci Res. 1999;58:191–201. - PubMed
    1. Colman H, Nabekura J, Lichtman JW. Alterations in synaptic strength preceding axon withdrawal. Science. 1997;275:356–361. - PubMed

Publication types

MeSH terms

LinkOut - more resources