. 2009 Apr 1;29(13):3992-4003.
doi: 10.1523/JNEUROSCI.5237-08.2009.

BARHL2 differentially regulates the development of retinal amacrine and ganglion neurons

Affiliations

BARHL2 differentially regulates the development of retinal amacrine and ganglion neurons

Qian Ding et al. J Neurosci. .

Abstract

Through transcriptional regulations, the BarH family of homeodomain proteins play essential roles in cell fate specification, cell differentiation, migration, and survival. Barhl2, a member of the Barh gene family, is expressed in retinal ganglion cells (RGCs), amacrine cells (ACs), and horizontal cells. Here, to investigate the role of Barhl2 in retinal development, Barhl2-deficient mice were generated. Analysis of AC subtypes in Barhl2-deficient retinas suggests that Barhl2 plays a critical role in AC subtype determination. A significant reduction of glycinergic and GABAergic ACs with a substantial increase in the number of cholinergic ACs was observed in Barhl2-null retinas. Barhl2 is also critical for the development of a normal complement of RGCs. Barhl2 deficiency resulted in a 35% increase in RGCs undergoing apoptosis during development. Genetic analysis revealed that Barhl2 functions downstream of the Atoh7-Pou4f3 regulatory pathway and regulates the maturation and/or survival of RGCs. Thus, BARHL2 appears to have numerous roles in retinal development, including regulating neuronal subtype specification, differentiation, and survival.


Figures
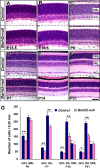
Figure 1.
Figure 1.
Developmental abnormality of Barhl2-null retinas. Retinas from control and Barhl2-null mice were analyzed by hematoxylin and eosin staining at different developmental stages. A, Compared with the controls, no overt change in retinal thickness and laminar structures is observed in Barhl2-null retinas before E15.5. B–F, From E16.5, the GCL of Barhl2-null retina is thinner, and the number of cells in the GCL is significantly reduced. This hypoplasia is maintained till P21. From P7, the INL also exhibits a marked reduction in cell numbers; at P21, the cell number in the INL is reduced 35.6%. The ONL thickness is normal. G, Quantitation of cells in the GCL and INL per 250 μm length of retinal section at P0–P21. Cell counting in NBL in C and ONL in E and F covers 62.5 μm linear length. *t test p < 0.01; **t test p < 0.001. Scale bar, 50 μm.
Figure 2.
Figure 2.
Effect of Barhl2-null mutation on RGCs and ACs in P21 retinas. Retinas were immunolabeled with indicated antibodies (green) and nuclear counterstained with propidium iodide (red). A, Loss of Barhl2 leads to a severe loss of RGCs immunoreactive for POU4F1 (average number of POU4F1+ RGCs ±SD: controls, 33 ± 5, n = 4; Barhl2 nulls, 22 ± 3, n = 4; p < 0.01, Student's t test). B, Loss of amacrine cells immunoreactive for PAX6 (average number of PAX6+ ACs ±SD: controls, 217 ± 11, n = 4; Barhl2 nulls, 142 ± 13, n = 4; p < 0.01, Student's t test). C–E, No significant alteration in horizontal cells immunoreactive for calbindin (C, average number of calbindin+ horizontal cells ±standard SD: controls, 8 ± 2, n = 4; Barhl2 nulls, 7 ± 2, n = 4; p = 0.63, Student's t test), bipolar cells immunoreactive for CHX10 (D, average number of CHX10+ bipolar cells ±SD: controls, 155 ± 11, n = 4; Barhl2 nulls, 161 ± 17, n = 4; p = 0.75, Student's t test), and photoreceptors immunoreactive for Opsin (E). F, Quantitation of immunoreactive cells per 250 μm length of retinal section at P21. *t test p < 0.01. Scale bar, 100 μm.
Figure 3.
Figure 3.
Analysis of RGCs and displaced ACs in the GCL of Barhl2-null retina. A–D, Retinas from control and Barhl2-null mice at P21 were coimmunolabeled with anti-PAX6 (red) and anti-POU4F2 (green) (A, B) or with anti-ISL1 (red) and anti-POU4F2 (green) (C, D). E, Quantitation of immunolabeling results. In the GCL of Barhl2-null retina, the total number of ACs and RGCs labeled by anti-PAX6 and anti-ISL1 are reduced by 13.8 and 28.3%, respectively. Specifically, the POU4F2-immunoreactive RGCs are decreased to 53%, whereas the POU4F2-negative and ISL1-positive cells are increased more than twofold. Cell numbers were counted in the central regions of at least three independent samples from each genotype. *t test p < 0.01. Scale bar, 50 μm.
Figure 4.
Figure 4.
Loss of RGCs in Barhl2-null retina. A, B, No overt change in the number of POU4F2 immunoreactive RGCs is detected in Barhl2-null retinas at and before E15.5. C–H, Starting at E16.5, there is a progressive reduction in RGCs in Barhl2-null retinas. Inserts show the enlarged views of boxed regions in the central retina. I, J, Ventral views of brains reveal optic nerves (arrowheads) and optic chiasm (arrow). K, L, Hematoxylin and eosin staining of optic nerve cross sections cut at the level indicated by the dashed lines in I and J. The cross-section areas (arrowheads) of the Barhl2-null optic nerves are reduced by ∼33.7% compared with controls (n = 3, p < 0.001, Student's t test). M, Quantitation of RGCs immunoreactive for POU4F2 in late embryonic stages and early postnatal days. *t test p < 0.01. N, O, Immunostaining of whole-mount retinas with anti-POU4F2 (green) and anti-lacZ (red) reveals a severe loss of lacZ+ RGCs (arrowhead; yellow) in Barhl2 null. P, Q, Lineage tracing analysis by immunostaining of whole-mount retinas with anti-GFP (green) and anti-POU4F2 (red) shows a severe reduction of Barhl2-lineage RGCs (arrowhead; yellow) in Barhl2 null. OC, Optic chiasm; OT, optic tract. Scale bars: (in B, D, F, and H) A–H, 50 μm; (in L) I–L, 300 μm; (in Q) N–Q, 25 μm.
Figure 5.
Figure 5.
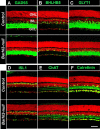
Subtype-specific effects on ACs Barhl2-null retina. Sections from P21 mouse retinas were immunolabeled with AC subtype-specific markers (green) and nuclear counterstained with PI (red). A–C, Loss of Barhl2 leads to a severe loss of ACs immunoreactive for GAD65 (A, average number of GAD65+ ACs ±SD: controls, 62 ± 6, n = 4; Barhl2 nulls, 39 ± 5, n = 4; p < 0.01, Student's t test), Bhlhb5 (B), and GLYT1 (C, average number of GLYT1+ ACs ±SD: controls, 89 ± 6, n = 4; Barhl2 nulls, 50 ± 3, n = 4; p < 0.001, Student's t test). D–F, There is also an overt increase of amacrine cells immunoreactive for Isl1 (D, average number of ISL1+ ACs ±SD: controls, 10 ± 2, n = 4; Barhl2 nulls, 18 ± 3, n = 4; p < 0.01, Student's t test), ChAT (E), and calretinin (F). Scale bar, 100 μm.
Figure 6.
Figure 6.
Cholinergic ACs are increased in Barhl2-null retinas. A, B, Double immunolabeling of control and Barhl2-null retinas with anti-ISL1 (green) and anti-ChAT (red) reveals a threefold increase in cholinergic ACs in the absence of Barhl2 at P21. C, D, In the GCL, there is a twofold increase in the displaced cholinergic ACs in Barhl2-null retinas. E, F, Upregulation of ISL1 expression in the ACL of Barhl2-null retina during the development of cholinergic amacrine cells (brackets). Scale bars, 25 μm.
Figure 7.
Figure 7.
Barhl2-null retinas exhibit an elevated cell apoptosis in ACs. A, B, Immunostaining of retina sections with PAX6 reveals a significant loss of PAX6+ amacrine cells (brackets) in Barhl2-null retina at P5. C, D, Anti-BHLHB5 immunostaining shows a decrease in a selective group of GABAergic amacrine cells in Barhl2-null retina (yellow arrowhead). E, F, Anti-activated CASP3 immunostaining shows an increase of apoptotic cells in the INL of Barhl2-null retina at P3. G–I, Expression of PAX6 (red) in apoptotic cells shown by anti-CASP3 (green) in Barhl2-null retina (yellow arrowhead) at P3. J, Quantification of apoptotic cells in the INL of the developing retina by averaging activated caspase3-positive cells in 10 sections per retina. The differences in apoptotic cell numbers in control and Barhl2-null retina are significant from P0 to P5. *t test p < 0.01. Scale bars, 100 μm.
Figure 8.
Figure 8.
Analysis of potential upstream and downstream genes of Barhl2. A–C, The expression profiles of retinogenic bHLH genes, Atoh7, Neurod4, and Neurod1, are unaffected in Barhl2-null retinas by in situ hybridization at E16.5. D, E, Barhl2 expression is downregulated in Atoh7-null and Pou4f2-null retinas. In situ hybridization reveals a reduced expression of Barhl2 in Atoh7-null (D) and Pou4f2-null (E) retinas at E13.5. L, Lens; NBL, neuroblast layer retina. Scale bars, 100 μm.
Figure 9.
Figure 9.
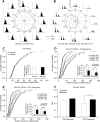
The retinal waves mediated by cholinergic synaptic transmission were affected in Barhl2-null mice. Spontaneous retinal waves were recorded from P3 and P13 Barhl2-null mice and age-matched WT controls. A, Example of retinal waves recorded from a P3 WT retina. Left column, Spike trains of 20 neurons. Center column, A diagram of the array showing a propagating retinal wave. Each frame shows the mean firing rate of each cell (averaged >0.5 s). The small black dots represent the position of electrodes. Each black circle represents one cell, with the radius of the circle proportional to its firing rate. Right column, Spike trains of 10 neurons selected from the time window shown in the left column and the position of each neuron is represented with the number in the center column. B, Normalized correlation index as a function of distance between the recording electrodes from both WT and Barhl2-null mice at the ages of P3 and P13, respectively. C, Average interwave interval of the spontaneous retinal waves of both Barhl2-null mice and age-matched WT controls, showing that waves are much less frequent in Barhl2-null mice in the first postnatal week. D, Average firing rate of RGCs of Barhl2-null mice and age-matched WT controls at the ages of P3 and P13, respectively.
Figure 10.
Figure 10.
Light-evoked responses of ON–OFF DSRGCs are impaired in Barhl2-null mice. Responses to the moving bars of 12 different directions were recorded from the cells located in the RGC layer of P15 Barhl2-null mice and age-matched WT controls. The cells were identified as ON, OFF, and ON–OFF cells based on the patterns of light responses, and the DSI and peak frequency of their light responses were calculated from the responses of each group of the cells. A, Representative polar plot turning curve (center) and peristimulus response histograms to the moving bars at 12 different directions of a non-DS ON cell from a P15 WT retina. This cell showed a weak directional selectivity (DSI = 0.022). B, Representative polar plot turning curve and peristimulus response histograms of a DS ON–OFF cell from a P15 WT retina. This cell had a stronger ON directional selectivity (DSI = 0.6 at 210°) but a weaker OFF directional selectivity (DSI = 0.333). C, Cumulative distribution curves of peak frequency of ON cells of Barhl2-null mice and WT controls. Inset, Average peak frequencies. D, Cumulative distribution curves of peak frequency of the preferred and null directions of ON responses of ON–OFF DSRGCs of Barhl2-null mice and WT controls. Inset, Average peak frequencies. E, Cumulative distribution curves of peak frequency of the preferred and null directions of OFF responses of ON–OFF DSRGCs of Barhl2-null mice and WT controls. Inset, Average peak frequencies. F, Average DSI of ON and OFF responses of ON–OFF DSRGCs of Barhl2-null mice and WT controls.

Similar articles

Cited by

References

    1. Auerbach W, Dunmore JH, Fairchild-Huntress V, Fang Q, Auerbach AB, Huszar D, Joyner AL. Establishment and chimera analysis of 129/SvEv- and C57BL/6-derived mouse embryonic stem cell lines. Biotechniques. 2000;29:1024–1028. 1030, 1032. - PubMed
    1. Bansal A, Singer JH, Hwang BJ, Xu W, Beaudet A, Feller MB. Mice lacking specific nicotinic acetylcholine receptor subunits exhibit dramatically altered spontaneous activity patterns and reveal a limited role for retinal waves in forming ON and OFF circuits in the inner retina. J Neurosci. 2000;20:7672–7681. - PMC - PubMed
    1. Bertrand N, Castro DS, Guillemot F. Proneural genes and the specification of neural cell types. Nat Rev Neurosci. 2002;3:517–530. - PubMed
    1. Bramblett DE, Pennesi ME, Wu SM, Tsai MJ. The transcription factor Bhlhb4 is required for rod bipolar cell maturation. Neuron. 2004;43:779–793. - PubMed
    1. Brown NL, Patel S, Brzezinski J, Glaser T. Math5 is required for retinal ganglion cell and optic nerve formation. Development. 2001;128:2497–2508. - PMC - PubMed

Publication types

MeSH terms