. 2009 Apr 1;29(13):4210-7.
doi: 10.1523/JNEUROSCI.0208-09.2009.

Cochlear damage changes the distribution of vesicular glutamate transporters associated with auditory and nonauditory inputs to the cochlear nucleus

Affiliations

Cochlear damage changes the distribution of vesicular glutamate transporters associated with auditory and nonauditory inputs to the cochlear nucleus

Chunhua Zeng et al. J Neurosci. .

Abstract

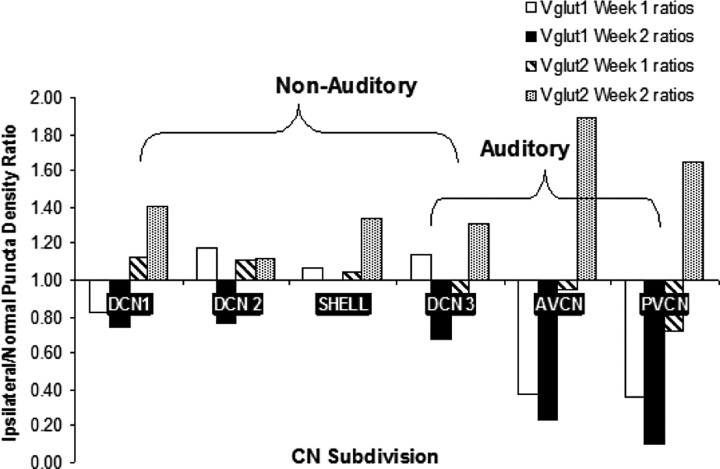
Integration of multimodal information is essential for understanding complex environments. In the auditory system, multisensory integration first occurs in the cochlear nucleus (CN), where auditory nerve and somatosensory pathways converge (Shore, 2005). A unique feature of multisensory neurons is their propensity to receive cross-modal compensation after deafening. Based on our findings that the vesicular glutamate transporters, VGLUT1 and VGLUT2, are differentially associated with auditory nerve and somatosensory inputs to the CN, respectively (Zhou et al., 2007), we examined their relative distributions after unilateral deafening. After unilateral intracochlear injections of kanamycin (1 and 2 weeks), VGLUT1 immunoreactivity (ir) in the magnocellular CN ipsilateral to the cochlear damage was significantly decreased, whereas VGLUT2-ir in regions that receive nonauditory input was significantly increased 2 weeks after deafening. The pathway-specific amplification of VGLUT2 expression in the CN suggests that, in compensatory response to deafening, the nonauditory influence on CN is significantly enhanced. One undesirable consequence of enhanced glutamatergic inputs could be the increased spontaneous rates in CN neurons that occur after hearing loss and that have been proposed as correlates of the phantom auditory sensations commonly called tinnitus.


Figures

Figure 1.
Figure 1.
Schematic of the locations within the CN that were used for measurements and micrographs. Each region of interest is indicated with square. A–C, Drawings of transverse sections from the rostral to caudal ends of CN. icp, Inferior cerebellar peduncle; tz, trapezoid body; 7n, facial nerve.
Figure 2.
Figure 2.
A, Mean ABR thresholds for five animals 1 (N = 5) and 2 (N = 4) weeks after deafening by an injection of kanamycin into the left cochlea. ABRs are shown before (left and right) and after (left and right) deafening. Three normal hearing, control animals (left and right ears) are also shown for comparison. ABRs indicate profound deafness at both 1 and 2 weeks after kanamycin injection. No effect of the kanamycin injections was observed in any of the right ears. Closed square symbols at 90 dB for 4 and 20 kHz indicate no response at the limits of the speaker (indicated by upward arrows). B, A representative cytocochleogram is shown from one guinea pig 1 week after a kanamycin injection into the left ear. The percentage of missing inner and outer hair cells is indicated along the length of the cochlea. The deafened cochlea showed complete hair cell loss (inner and outer) in the basal half of the cochlea and severe inner and outer hair cell loss in the remaining 20% of the cochlea, excluding the apex. There was hair cell preservation only in the apical 10% of the cochlea. The yellow line shows the extent of hair cell loss in the normal (contralateral) ear. C, Spiral ganglion counts (SGC) are shown for eight animals, 1 (N = 4) and 2 (N = 4) weeks after kanamycin injections into the cochlea. Mean spiral ganglion densities for the whole cochlea and the basal turn at 1 and 2 weeks after cochlear damage are shown. Filled asterisks indicate significant differences of p < 0.01.
Figure 3.
Figure 3.
VGLUT1-ir is decreased, whereas VGLUT2 is increased in the CN ipsilateral to the cochlear damage. A–D, Photomicrographs of VGLUT1-ir from the VCNm of one animal (2 weeks after deafening). A, B, VGLUT1-ir in the AVCNm. VGLUT1 is strongly expressed in AVCNm on the control side (B) as previously shown (Zhou et al., 2007) but weakly expressed after deafening (A). C, D, VGLUT1-ir in the PVCNm. VGLUT1 is sparsely expressed in ipsilateral PVCNm compared with contralateral side. The decrease in VGLUT1-ir reflects primarily decreased VIIIth nerve synaptic inputs after kanamycin injections into the cochlea. E, F, Photomicrographs of VGLUT2-ir from SHELL regions of CN. VGLUT2-ir in the ipsilateral SHELL region is increased compared with the contralateral side. Scale bars: A–D, 50 μm; E, F, 20 μm.
Figure 4.
Figure 4.
Mean VGLUT1 puncta densities in each CN subdivision in the ipsilateral, contralateral, and normal control CNs (N = 6), 1 (N = 5) and 2 weeks (N = 5) after deafness. VGLUT1 puncta densities (expressed as thousands per square millimeters) are significantly decreased in the ipsilateral (compared with the contralateral and normal CNs) AVCNm, PVCNm, and DCN1 compared with both the contralateral and normal control CNs (p < 0.0003, open stars). The magnocellular VCN receives major VIIIth nerve synaptic terminals.
Figure 5.
Figure 5.
Mean VGLUT2 puncta densities in each CN subdivision, ipsilateral, contralateral, and normal control CNs (N = 6), 1 (N = 5) and 2 weeks (N = 5) after deafness. VGLUT2 puncta densities at 2 weeks are significantly increased in the ipsilateral (compared with the contralateral and normal CNs) Shell and DCN2 that receive nonauditory synaptic terminals. Filled stars indicate p < 0.001. VGLUT2 puncta densities are also significantly increased but to a lesser extent in DCN3, which receives both VIIIth nerve and nonauditory inputs. Error bars represent SEM.
Figure 6.
Figure 6.
VGLUT immunoreactivity in the CN ipsilateral (N = 10) to the deafening is replotted as ratios over the normal ears (N = 6), where 1 = no difference between deafened and normal ears. A, The distributions of VGLUT1 and VGLUT2-ir across different regions of the CN are shown in the same figure to highlight the changes in the relative distributions of the two VGLUT transporters after deafness. At both 1 and 2 weeks after deafness, ipsilateral VGLUT1 is decreased in VCNm (AVCN and PVCN) and DCN3, reflecting the large reduction of VIIIth nerve terminals after hair cell loss after the kanamycin injections. By 2 weeks, VGLUT1 is decreased more dramatically in all regions. In contrast, VGLUT2-ir is elevated above normal in DCN1, DCN2, and the Shell regions at 1 week after deafness and is elevated in all regions by 2 weeks. The areas receiving primarily auditory nerve inputs or nonauditory inputs are designated by the curly brackets above the graphs.

Similar articles

Cited by

References

    1. Alibardi L. Mossy fibers in granule cell areas of the rat dorsal cochlear nucleus from intrinsic and extrinsic origin innervate unipolar brush cell glomeruli. J Submicrosc Cytol Pathol. 2004;36:193–210. - PubMed
    1. Babalian AL. Synaptic influences of pontine nuclei on cochlear nucleus cells. Exp Brain Res. 2005;167:451–457. - PubMed
    1. Batzri-Izraeli R, Kelly JB, Glendenning KK, Masterton RB, Wollberg Z. Auditory cortex of the long-eared hedgehog (Hemiechinus auritus). I. Boundaries and frequency representation. Brain Behav Evol. 1990;36:237–248. - PubMed
    1. Bauer CA, Brozoski TJ, Myers K. Primary afferent dendrite degeneration as a cause of tinnitus. J Neurosci Res. 2007;85:1489–1498. - PubMed
    1. Benson TE, Brown MC. Postsynaptic targets of type II auditory nerve fibers in the cochlear nucleus. J Assoc Res Otolaryngol. 2004;5:111–125. - PMC - PubMed

Publication types

MeSH terms

Substances