. 2009 Apr 1;29(13):4274-86.
doi: 10.1523/JNEUROSCI.5602-08.2009.

Subunit- and pathway-specific localization of NMDA receptors and scaffolding proteins at ganglion cell synapses in rat retina

Affiliations

Subunit- and pathway-specific localization of NMDA receptors and scaffolding proteins at ganglion cell synapses in rat retina

Jun Zhang et al. J Neurosci. .

Abstract

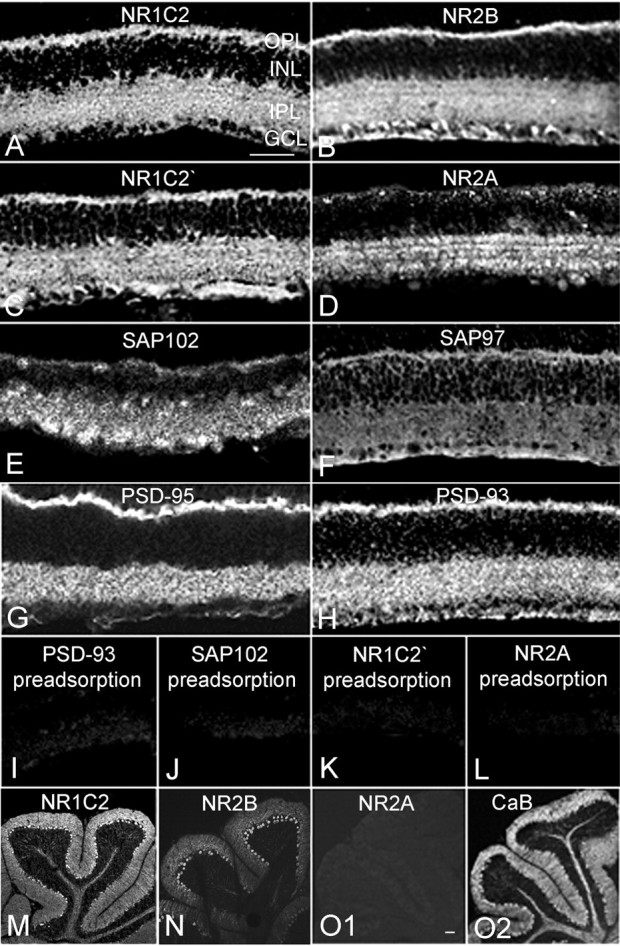
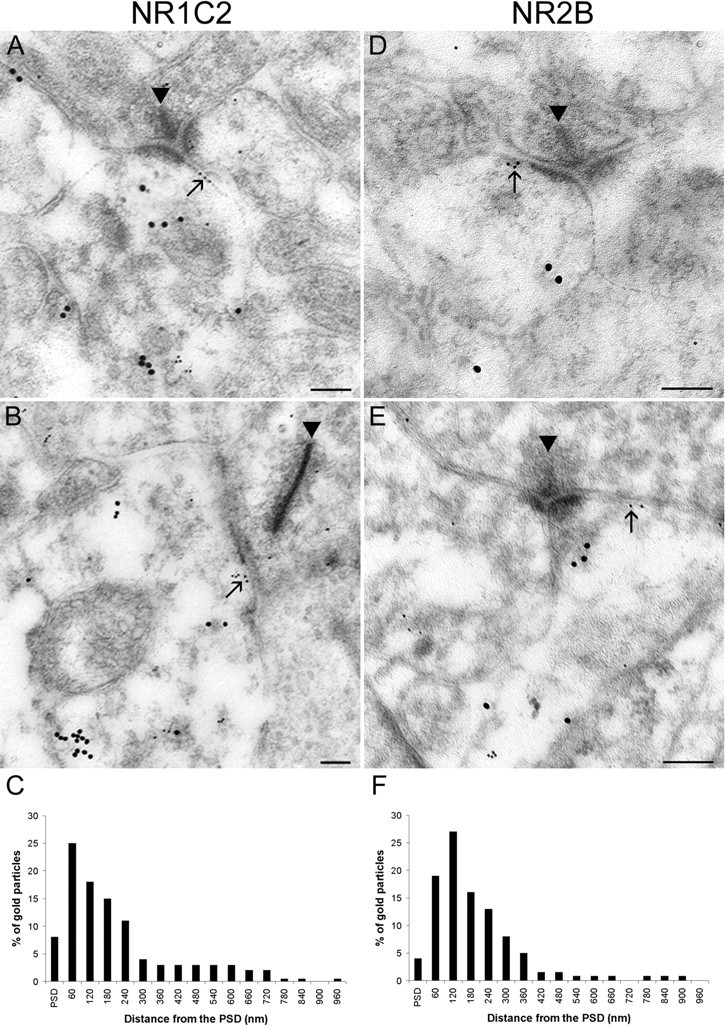
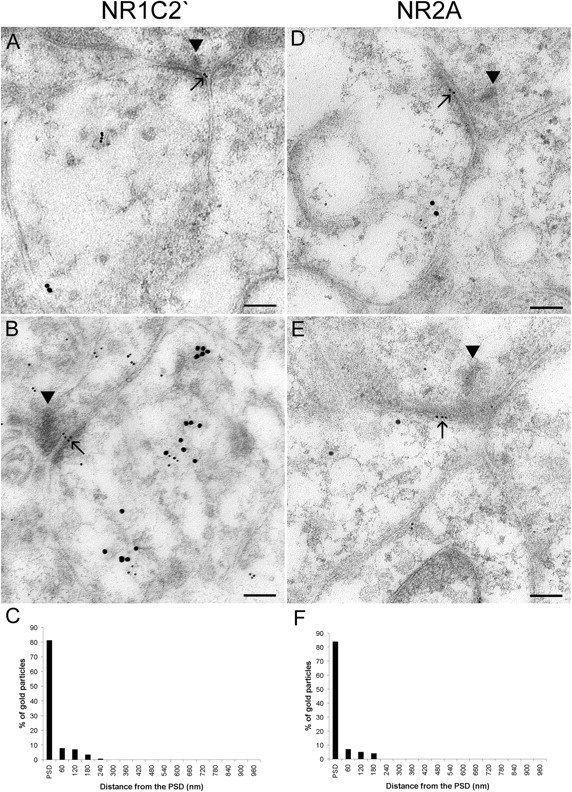
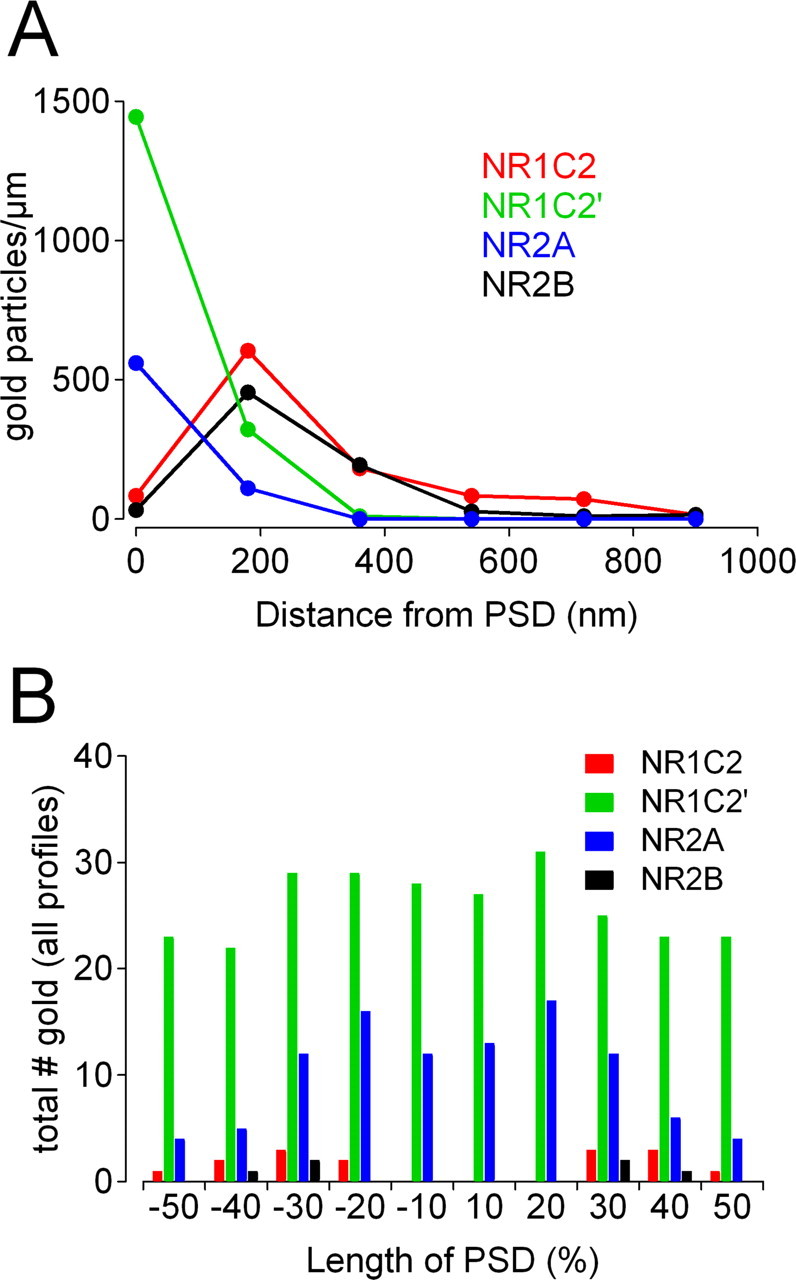
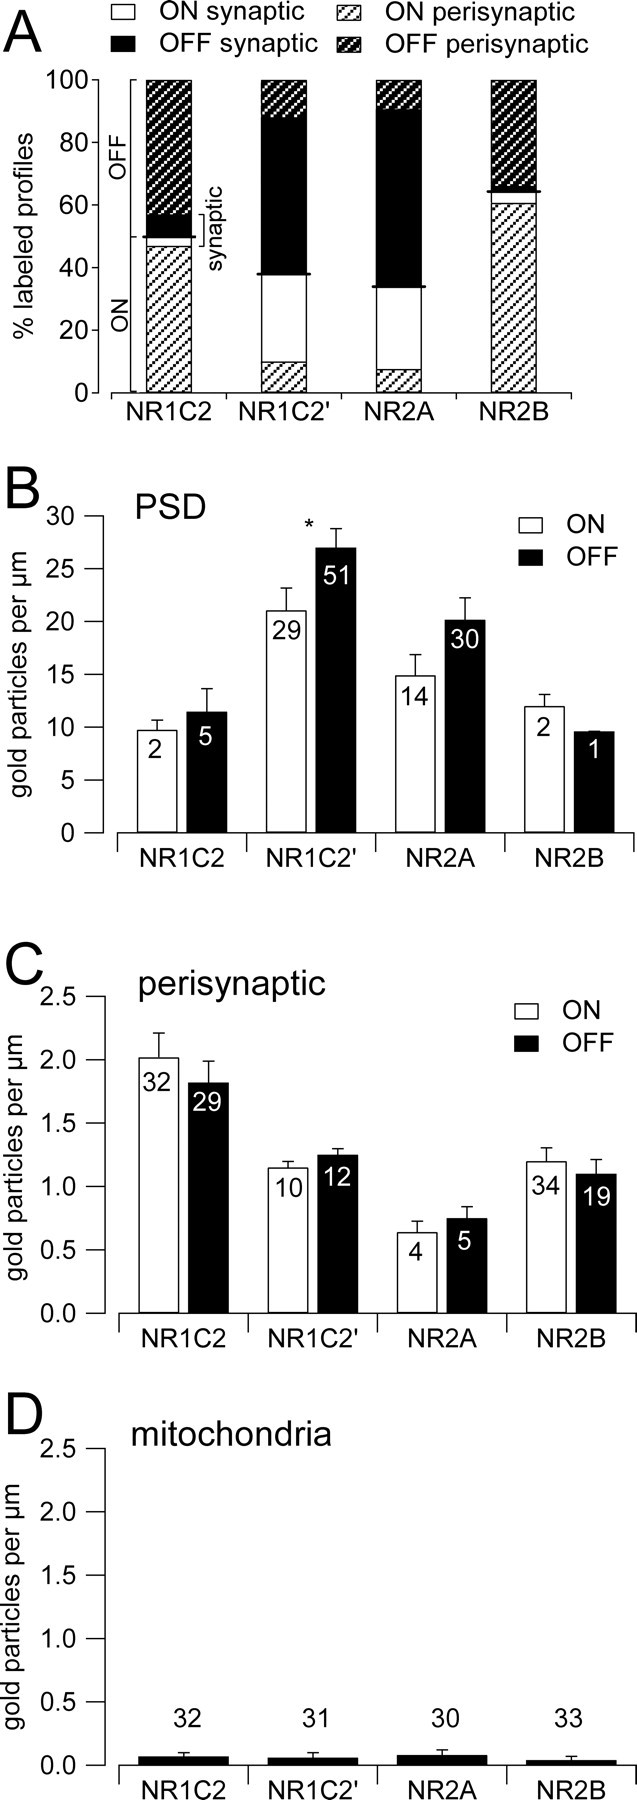
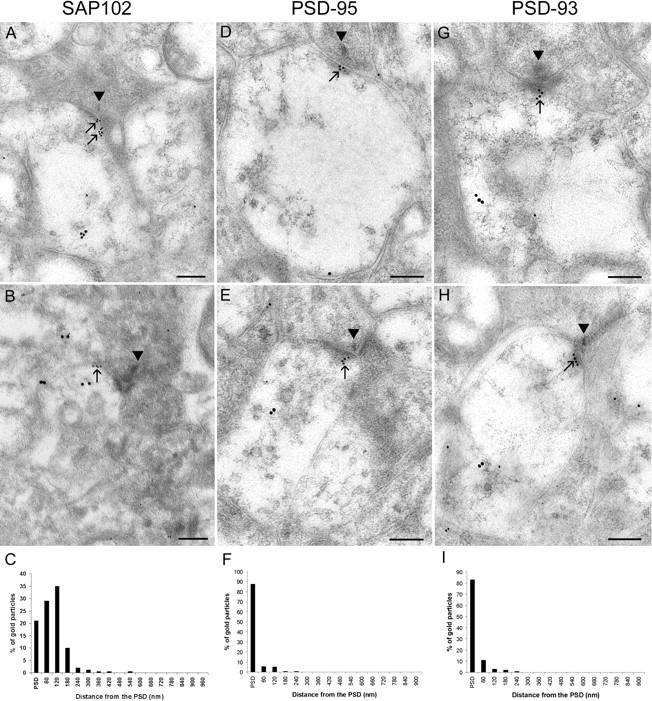
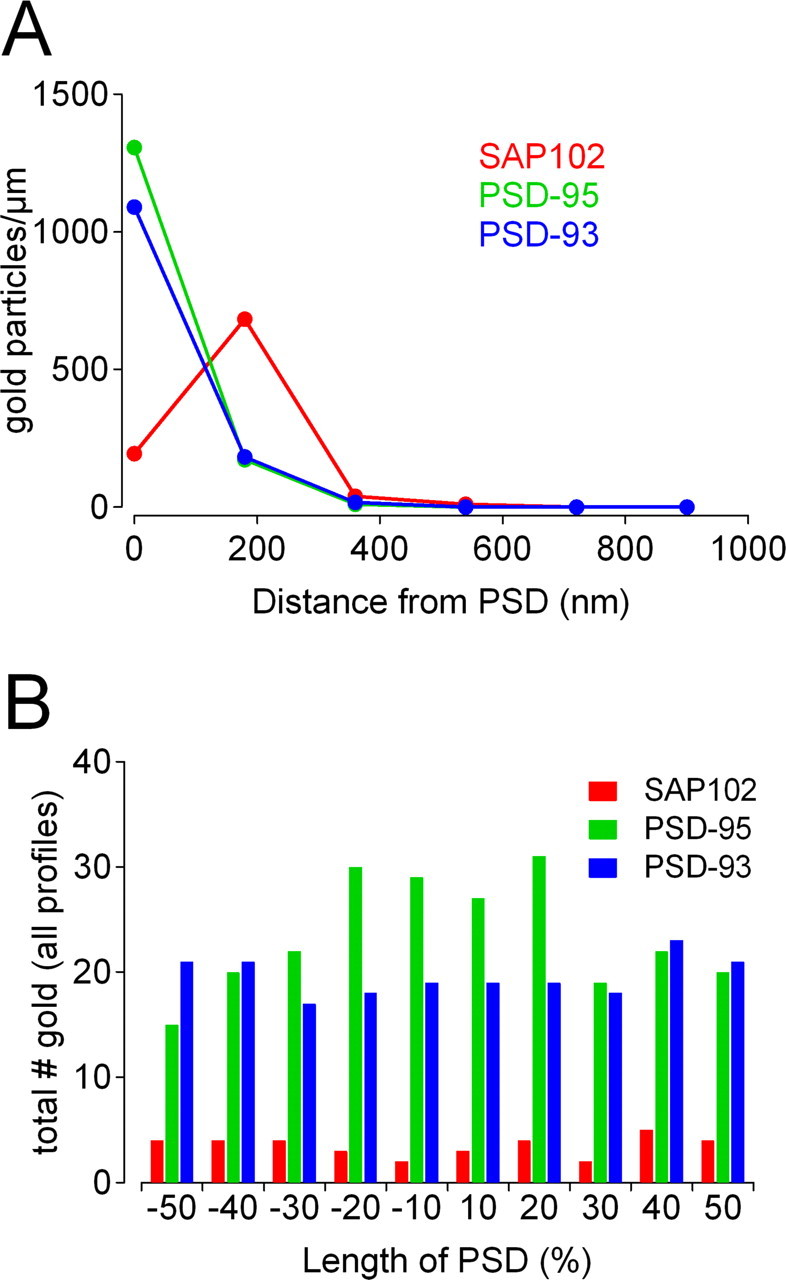
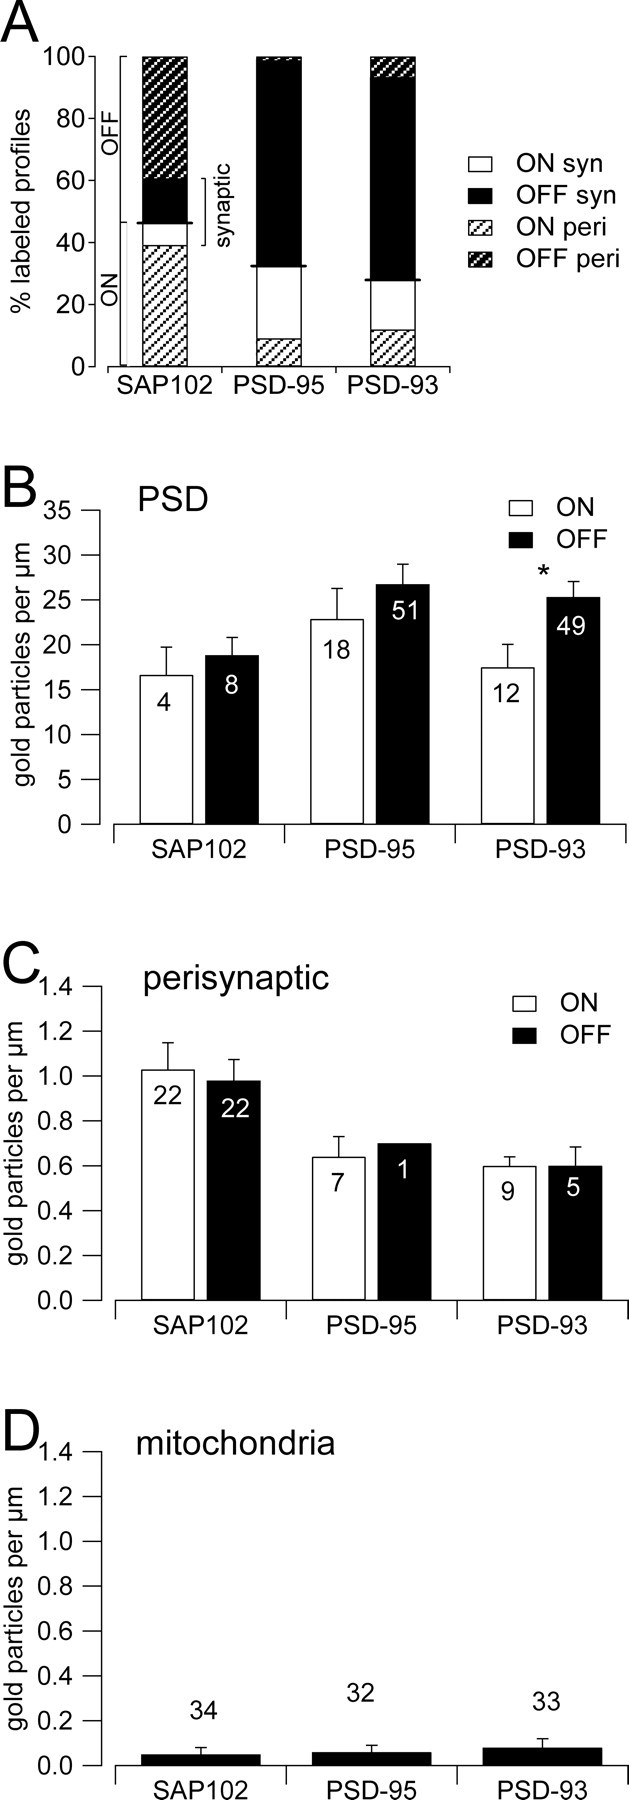
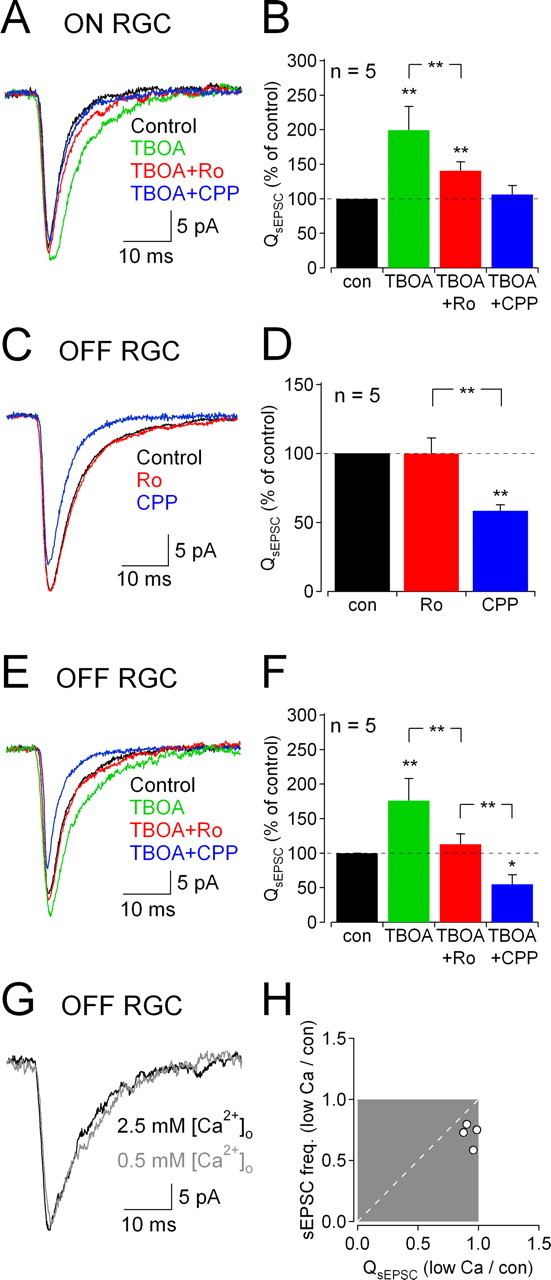
Retinal ganglion cells (RGCs) receive excitatory glutamatergic input from ON and OFF bipolar cells in distinct sublaminae of the inner plexiform layer (IPL). AMPA and NMDA receptors (AMPARs and NMDARs) mediate excitatory inputs in both synaptic layers, but specific roles for NMDARs at RGC synapses remain unclear. NMDARs comprise NR1 and NR2 subunits and are anchored by membrane-associated guanylate kinases (MAGUKs), but it is unknown whether particular NR2 subunits associate preferentially with particular NR1 splice variants and MAGUKs. Here, we used postembedding immunogold electron microscopy techniques to examine the subsynaptic localization of NMDAR subunits and MAGUKs at ON and OFF synapses onto rat RGCs. We found that the NR2A subunit, the NR1C2' splice variant, and MAGUKs PSD-95 and PSD-93 are localized to the postsynaptic density (PSD), preferentially at OFF synapses, whereas the NR2B subunit, the NR1C2 splice variant, and the MAGUK SAP102 are localized perisynaptically, with NR2B exhibiting a preference for ON synapses. Consistent with these anatomical data, spontaneous EPSCs (sEPSCs) recorded from OFF cells exhibited an NMDAR component that was insensitive to the NR2B antagonist Ro 25-6981. In ON cells, sEPSCs expressed an NMDAR component, partially sensitive to Ro 25-6981, only when glutamate transport was inhibited, indicating perisynaptic expression of NR2B NMDARs. These results provide the first evidence for preferential association of particular NR1 splice variants, NR2 subunits, and MAGUKs at central synapses and suggest that different NMDAR subtypes may play specific roles at functionally distinct synapses in the retinal circuitry.


Figures

Figure 1.
Figure 1.
Light microscopy immunoreactivity (IR) for NMDAR subunits and MAGUK proteins in the rat retina. A–D, NMDAR subunit IR is evident in the IPL, OPL, GCL, and INL. E–H, MAGUK protein IR is evident primarily in the IPL and OPL. I–L, Preadsorption with peptide antigen (e.g., for PSD-93, SAP102, NR1C2′, and NR2A) blocks primary antibody IR. M–N, IR of NR1C2 and NR2B on cryosections of rat cerebellum. O, Double labeling of NR2A (O1) and Calbindin D-28k (O2) on the same cryosection of rat cerebellum. Scale bars: 50 μm (in A, corresponds to A–L; in O1, corresponds to M–O2).
Figure 2.
Figure 2.
Immunogold labeling shows perisynaptic localization of NR1C2 and NR2B at cone bipolar cell dyads. A, B, Labeling for NR1C2 (small particles, arrow) and CTB (large particles). Presynaptic ribbons indicated by arrowheads. C, Histogram showing the tangential distribution of gold labeling NR1C2 at synapses in ON and OFF sublaminae (n = 68 profiles). D, E, Labeling for NR2B (small particles, arrow) and CTB (large particles). Micrographs in A and D show profiles in ON sublaminae; micrographs in B and E show profiles in OFF sublaminae. F, Histogram showing the tangential distribution of gold labeling NR2B in ON and OFF sublaminae (n = 56 profiles). No significant difference was observed between the distributions in C and F (Kolmogorov–Smirnov test, p = 0.19). The perisynaptic region was divided into 60 nm bins. Scale bars: 0.1 μm.
Figure 3.
Figure 3.
Immunogold labeling shows synaptic localization of NR1C2′ and NR2A at cone bipolar cell dyads. A, B, Labeling for NR1C2′ (small particles, arrow) and CTB (large particles). Presynaptic ribbons indicated by arrowheads. C, Histogram showing the tangential distribution of gold labeling NR1C2′ in ON and OFF sublaminae (n = 102 profiles). D, E, Labeling for NR2A (small particles, arrow) and CTB (large particles). Micrographs in A and D show profiles in ON sublaminae; micrographs in B and E show profiles in OFF sublaminae. F, Histogram showing the tangential distribution of gold labeling NR2A in ON and OFF sublaminae (n = 53 profiles). No significant difference was observed between the distributions in C and F (Kolmogorov–Smirnov test, p = 1.00). The perisynaptic region was divided into 60 nm bins. Scale bars: 0.1 μm.
Figure 4.
Figure 4.
Comparison of NMDAR subunit localization in RGC dendrites. A, Histogram showing labeling density of immunogold particles for NR1C2 (n = 68 profiles), NR1C2′ (n = 102 profiles), NR2A (n = 53 profiles), and NR2B (n = 56 profiles). The perisynaptic region was divided into 180 nm bins from the edge of the PSD. B, Histogram showing the tangential distribution of the total number of immunogold particles for NR1C2 (n = 7 profiles), NR1C2′ (n = 80 profiles), NR2A (n = 44 profiles), and NR2B (n = 3 profiles) at all profiles with labeling within the PSD.
Figure 5.
Figure 5.
Quantitative comparison of NMDAR subunits in RGC dendrites in the ON and OFF sublaminae. A, Cumulative bar graph showing the relative fraction of IR-positive dendritic profiles in the ON (light) and OFF (dark) sublaminae, within the PSD (solid) and in perisynaptic membranes (hatched). In each bar, the thick black line marks the relative proportion of ON and OFF profiles. The ratio of solid and hatched regions (light or dark) indicates the relative amounts of synaptic and perisynaptic expression. B, Comparison of particle density within the IR-positive PSDs in the ON (open) and OFF (solid) sublaminae. C, Comparison of particle density in IR-positive perisynaptic membranes in the ON (open) and OFF (solid) sublaminae. D, Particle density in mitochondrial membrane indicates relatively little nonspecific IR (ON and OFF sublaminae combined). n values indicate the number of profiles analyzed.
Figure 6.
Figure 6.
Immunogold labeling shows subsynaptic localization of MAGUK proteins. A, B, Labeling for SAP102 (small particles, arrow) and CTB (large particles). Presynaptic ribbons indicated by arrowheads. C, Histogram showing the tangential distribution of gold labeling SAP102 (n = 56 profiles). D, E, Labeling for PSD-95 (small particles, arrow) and CTB (large particles). F, Histogram showing the tangential distribution of gold labeling PSD-95 (n = 77 profiles). G, H, Labeling for PSD-93 (small particles, arrow) and CTB (large particles). Micrographs in A, D, and G show profiles in ON sublaminae; micrographs in B, E, and H show profiles in OFF sublaminae. I, Histogram showing the tangential distribution of gold labeling PSD-93 (n = 75 profiles). No significant difference was observed between the distributions in F and I (Kolmogorov–Smirnov test, p = 1.00). The perisynaptic region was divided into 60 nm bins. Scale bars: 0.1 μm.
Figure 7.
Figure 7.
Comparison of MAGUK protein localization in RGC dendrites. A, Histogram showing labeling density of immunogold particles for SAP102 (n = 56 profiles), PSD-95 (n = 77 profiles), and PSD-93 (n = 75 profiles). The perisynaptic region was divided into 180 nm bins from the edge of the PSD. B, Histogram showing the tangential distribution of the total number of immunogold particles for SAP102 (n = 12 profiles), PSD-95 (n = 69 profiles), and PSD-93 (n = 61 profiles) at all profiles with labeling within the PSD.
Figure 8.
Figure 8.
Quantitative comparison of MAGUK proteins in RGC dendrites in the ON and OFF sublaminae. A, Cumulative bar graph showing the relative fraction of IR-positive dendritic profiles in the ON (light) and OFF (dark) sublaminae, within the PSD (syn; solid) and in perisynaptic membranes (peri; hatched). In each bar, the thick black line marks the relative proportion of ON and OFF profiles. The ratio of solid and hatched regions (light or dark) indicates the relative amounts of synaptic and perisynaptic expression. B, Comparison of particle density within the IR-positive PSDs in the ON (open) and OFF (solid) sublaminae. C, Comparison of particle density in IR-positive perisynaptic membranes in the ON (open) and OFF (solid) sublaminae. D, Particle density in mitochondrial membrane indicates relatively little nonspecific IR (ON and OFF sublaminae combined). n values indicate the number of profiles analyzed.
Figure 9.
Figure 9.
Distinct NMDAR subtype contributions to sEPSCs at ON and OFF synapses. A, Average sEPSCs recorded form a morphologically identified ON RGC (Vhold = −80 mV, 1 μm TTX, 100 μm d-serine, 0 [Mg2+]o, inhibition blocked). Reducing glutamate uptake with the transporter antagonist TBOA (10 μm, green, 95 events averaged) conferred a slow component onto the sEPSC waveform compared with control (black, 135 events). This TBOA-induced component was reduced by the NR2B NMDAR-specific antagonist Ro 25-6981 (Ro, 1 μm, red, 106 events) and abolished completely by the pan-NMDAR antagonist CPP (10 μm, blue, 110 events). B, Summarized effects of TBOA, Ro 25-6981, and CPP in five ON RGCs. C, Average sEPSCs recorded from an identified OFF RGC in the same control conditions as above (black, 425 events). In the absence of TBOA, Ro 25-6981 (red, 202 events) had no effect on the sEPSC waveform but CPP blocked a slow component (blue, 88 events), indicating the presence of synaptic NMDARs that lack NR2B subunits. D, Summarized effects of Ro 25-6981 and CPP in five OFF RGCs. E, Average sEPSCs recorded from an identified OFF RGC in the same control conditions as above (black, 133 events). Addition of TBOA enhanced the sEPSC waveform (green, 110 events), revealing a component that was eliminated by Ro 25-6981 (red, 120 events). CPP reduced the sEPSC waveform further (blue, 100 events). F, Summarized effects of TBOA, Ro 25-6981, and CPP in five OFF RGCs. G, Average sEPSCs recorded from an identified OFF RGC in the presence of TBOA (with inhibition blocked), in control (2.5 mm) [Ca2+]o (black, 89 events) or low (0.5 mm) [Ca2+]o (gray, 59 events). H, Effects of changing [Ca2+]o on sEPSC frequency and charge transfer in four OFF RGCs con, Control.

Similar articles

Cited by

References

    1. Al-Hallaq RA, Yasuda RP, Wolfe BB. Enrichment of N-methyl-d-aspartate NR1 splice variants and synaptic proteins in rat postsynaptic densities. J Neurochem. 2001;77:110–119. - PubMed
    1. Al-Hallaq RA, Conrads TP, Veenstra TD, Wenthold RJ. NMDA di-heteromeric receptor populations and associated proteins in rat hippocampus. J Neurosci. 2007;27:8334–8343. - PMC - PubMed
    1. Amthor FR, Takahashi ES, Oyster CW. Morphologies of rabbit retinal ganglion cells with complex receptive fields. J Comp Neurol. 1989;280:97–121. - PubMed
    1. Andressen C, Blümcke I, Celio MR. Calcium-binding proteins: selective markers of nerve cells. Cell Tissue Res. 1993;271:181–208. - PubMed
    1. Aoki C, Miko I, Oviedo H, Mikeladze-Dvali T, Alexandre L, Sweeney N, Bredt DS. Electron microscopic immunocytochemical detection of PSD-95, PSD-93, SAP-102, and SAP-97 at postsynaptic, presynaptic, and nonsynaptic sites of adult and neonatal rat visual cortex. Synapse. 2001;40:239–257. - PubMed

Publication types

MeSH terms

LinkOut - more resources