. 2009 Apr 1;23(7):877-89.
doi: 10.1101/gad.1771409.

Mouse models of human AML accurately predict chemotherapy response

Affiliations

Mouse models of human AML accurately predict chemotherapy response

Johannes Zuber et al. Genes Dev. .

Abstract

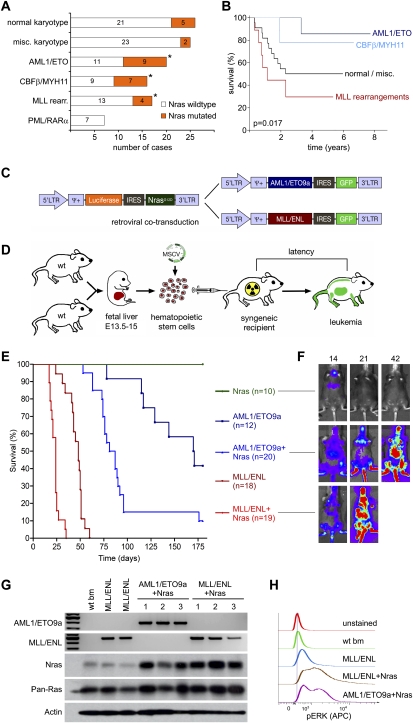
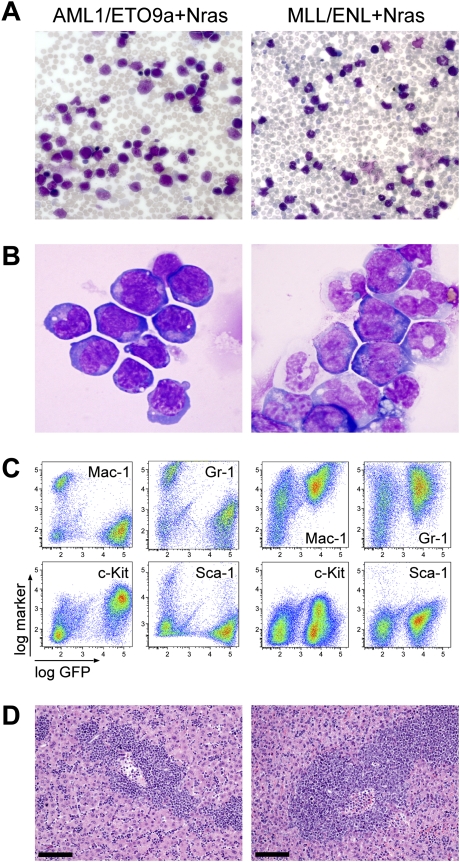
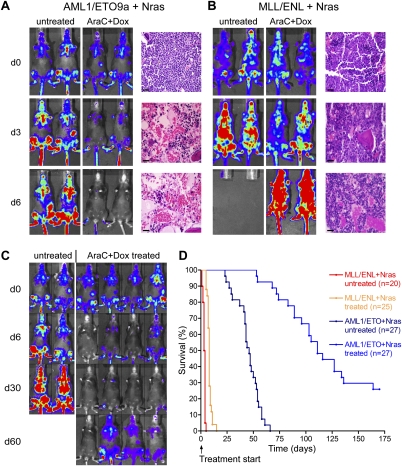
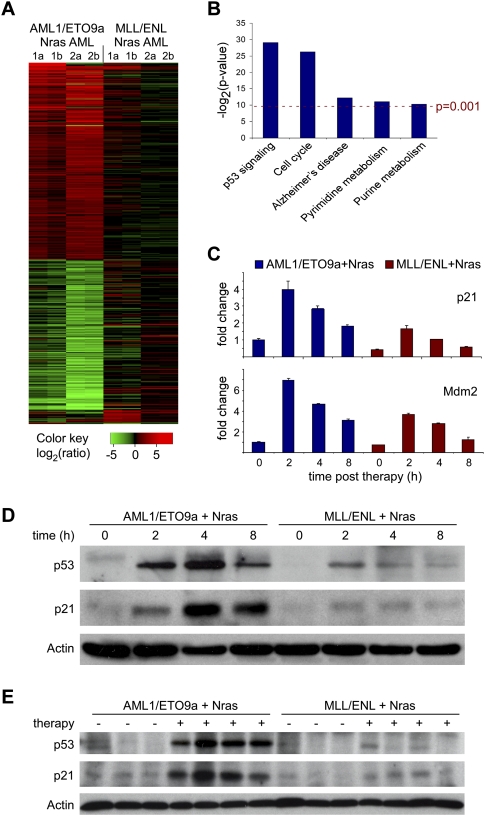
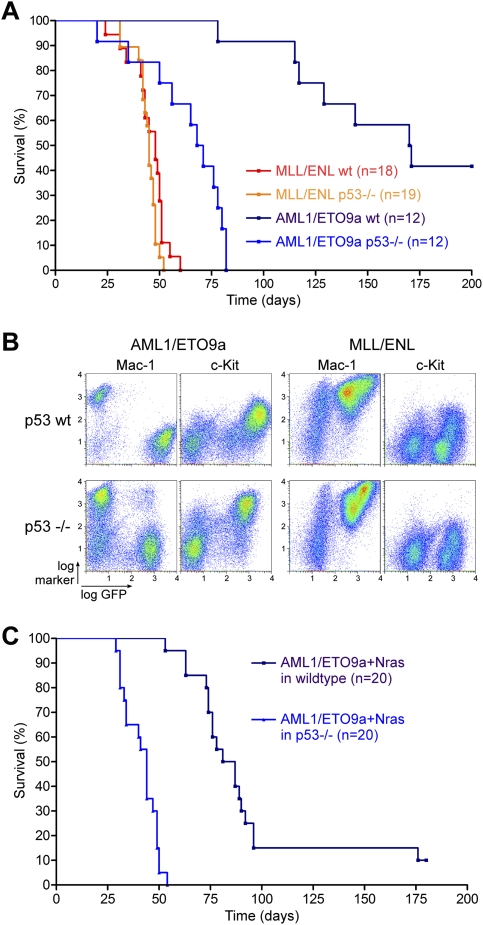
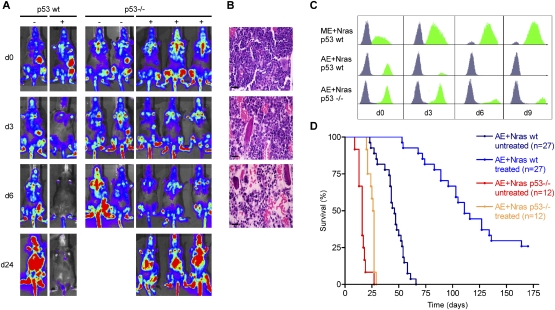
The genetic heterogeneity of cancer influences the trajectory of tumor progression and may underlie clinical variation in therapy response. To model such heterogeneity, we produced genetically and pathologically accurate mouse models of common forms of human acute myeloid leukemia (AML) and developed methods to mimic standard induction chemotherapy and efficiently monitor therapy response. We see that murine AMLs harboring two common human AML genotypes show remarkably diverse responses to conventional therapy that mirror clinical experience. Specifically, murine leukemias expressing the AML1/ETO fusion oncoprotein, associated with a favorable prognosis in patients, show a dramatic response to induction chemotherapy owing to robust activation of the p53 tumor suppressor network. Conversely, murine leukemias expressing MLL fusion proteins, associated with a dismal prognosis in patients, are drug-resistant due to an attenuated p53 response. Our studies highlight the importance of genetic information in guiding the treatment of human AML, functionally establish the p53 network as a central determinant of chemotherapy response in AML, and demonstrate that genetically engineered mouse models of human cancer can accurately predict therapy response in patients.


Figures

Figure 1.
Figure 1.
Generation of genetically defined mosaic mouse models based on common genetic associations in human AML. (A) Frequency of Nras mutations in 111 cases of pediatric AML in major karyotype groups. Asterisks indicate significant association in multifactor dimensionality reduction analysis (Ritchie et al. 2001). (B) Kaplan-Meier plot showing the overall survival of pediatric AML patients treated after 1998 depending on major karyotype group, including t(8;21) = AML1/ETO (n = 10), inv(16)/t(16;16) = CBFB/MYH11 (n = 9), and 11q23/MLL rearrangements (n = 9) compared with other subtypes (n = 22, excluding patients with PML/RARα positive AML). The presence of AML1/ETO and MLL fusion proteins has opposite effects on long-term therapy outcome. In an independent analysis using the same data set, Nras mutations were associated with a slightly better 5-yr survival with low-statistic significance (5-yr survival 79.4 vs. 50.4%, P = 0.09). (C) MSCV-based retroviral constructs used to coexpress AML oncogenes with fluorescent and bioluminescent markers. (D) Schematic overview of mosaic AML mouse models. Wild-type C57BL/6 FLCs isolated at E13.5–E15 were (co)transduced with oncogenic retroviruses and used to reconstitute the hematopoietic system of lethally irradiated recipient mice. (E) Mice reconstituted with FLCs transduced with the indicated transgenes were monitored for illness for 180 d and died or were euthanized at a terminal disease stage. The data are presented in a Kaplan–Meier format showing the percentage of mouse survival at various time points post-transplantation. Five recipients of FLCs transduced with Nras only were followed up further; three succumbed to leukemias after 212, 287, and 292 d, likely after accumulating additional lesions. (F) Luciferase imaging of recipient mice of FLCs transduced with the indicated genes at 14, 21, and 42 d following transplantation. Transduction of Luciferase-IRES-Nras rapidly induces onset of Luciferase-positive disease only in concert with AML1/ETO9a or MLL/ENL. (G) Expression analysis of retroviral oncogenes in wild-type bone marrow (wt bm) and independent primary AMLs (1–3) with indicated genotypes. Expression of human AML1/ETO9a and MLL/ENL transcripts was verified by RT–PCR using fusion site-specific primers. Reverse transcriptase free control reactions were negative in all samples (data not shown). Western blot analysis using pan-Ras and Nras-specific antibodies demonstrating Nras overexpression in leukemia lysates derived from Nras-cotransduced FLCs. Overall Ras levels (pan-Ras) do not show significant elevation. (H) Baseline phospho-Erk levels are strongly elevated in leukemias deriving from Nras-cotransduced FLCs. Levels of phosphorylated Erk were measured using phospho-specific flow cytometry in wild-type whole bone marrow and GFP-positive MLL/ENL, MLL/ENL + Nras, and AML1/ETO9a + Nras leukemias. Representative histograms are shown.
Figure 2.
Figure 2.
Defined mosaic AML mouse models have genotype-dependent morphology consistent with human AML. May-Grünwald-Giemsa-stained peripheral blood smears (A) (original magnification 200×) and Wright-Giemsa-stained bone marrow cytocentrifugation (B) (original magnification 1000×) predominantly show immature blasts in AML1/ETO9a + Nras leukemia, while MLL/ENL + Nras leukemia is characterized by more mature myelomonocytic cells at various differentiation levels. (C) Bone marrow immunphenotyping in AML1/ETO9a + Nras leukemic mice shows infiltration of GFP+/c-Kit+/Mac-1/Gr-1 immature blasts, while MLL/ENL + Nras bone marrow is dominated by GFP+/c-Kit−/lo/Mac-1+/Gr-1+ myelomonocytic cells. (D) Hematoxylin–eosin-stained liver sections showing massive leukemic infiltration. Bars, 100 μm.
Figure 3.
Figure 3.
AML1/ETO9a + Nras and MLL/ENL + Nras AMLs show dramatic differences in their response to combined chemotherapy in vivo. (A,B) Luciferase imaging and histological analysis of hematoxylin–eosin-stained bone marrow sections before (d0), during (d3), and after (d6) 5 d of chemotherapy show therapy-triggered regression and, ultimately, complete remission of AML1/ETO9a + Nras leukemia (A), while MLL/ENL + Nras leukemia (B) only shows decelerated progression, with persistence of blasts in response to treatment. Bars, 50 μm. (C) Long-term follow-up luciferase imaging of untreated and treated AML1/ETO9a + Nras leukemia. Treated mice achieve durable remissions lasting at least 30 d (d30). While most mice subsequently relapse, some mice remain in remission following chemotherapy (d60). (D) Kaplan-Meier survival curves of untreated and treated AML1/ETO9a + Nras and MLL/ENL + Nras mice following the initiation of chemotherapy.
Figure 4.
Figure 4.
In vivo expression analysis of immediate chemotherapy response programs identifies differences in p53 induction between AML1/ETO9a + Nras and MLL/ENL + Nras AMLs. (A) Chemotherapy-induced gene expression changes in AML1/ETO9a + Nras and MLL/ENL + Nras leukemias 2 h after combined chemotherapy rendered in a green–black–red pseudo color scheme for all genes with an average fold change ≥2.0 in either genotype. Samples included two independent primary leukemias (1,2) for each genotype, which were analyzed in two technical replicates (a,b). AML1/ETO9a + Nras leukemias show complex gene expression changes in response to chemotherapy, while this response profile is blunted in the MLL/ENL + Nras context. (B) KEGG pathways analysis (Ogata et al. 1999) of the AML1/ETO9a + Nras-specific chemotherapy response signature identified by SAM (FDR 0.2, fold change >2). Used P-values represent the EASE score (modified Fisher exact P-value) provided by the DAVID analysis tool (Dennis et al. 2003) available at http://david.abcc.ncifcrf.gov/summary.jsp. Two highly and three moderately significant pathway alterations are identified. (C) Quantitative real-time PCR analysis of p21 and Mdm2 at various time points after chemotherapy in vivo. Baseline expression and induction of both p53 target gene transcripts is attenuated in MLL/ENL + Nras leukemia. (D) Western blot analysis of p53 and p21 in leukemic spleens (>85% GFP+ infiltration) at various time points after i.p. administration of one dose of combined chemotherapy. AML1/ETO9a + Nras AML shows much stronger p53 induction, resulting in a stronger and more durable induction of its target p21. (E) Western blot analysis of p53 and p21 in recipient mice that were transplanted with independent primary AMLs and were either left untreated () or were treated with one dose of combined chemotherapy 4 h prior to sample harvest (+). Individual differences in p53 drug response programs are dependent on the AML genotype.
Figure 5.
Figure 5.
Loss of p53 dramatically accelerates AML1/ETO9a, but does not affect MLL/ENL-induced leukemogenesis. (A) Kaplan-Meier survival curves of lethally irradiated recipient mice, which were reconstituted with wild-type or p53−/− FLCs transduced with either AML1/ETO9a or MLL/ENL. Loss of p53 accelerates AML1/ETO9a-induced but not MLL/ENL-induced leukemogenesis. (B) Bone marrow immunophenotyping of wild-type and p53-deficient AML1/ETO9a- and MLL/ENL-induced leukemias. Loss of p53 does not affect the typical disease morphology induced by both fusion proteins. (C) Kaplan-Meier survival curves of lethally irradiated recipient mice, which were reconstituted with wild-type or p53−/− FLCs cotransduced with AML1/ETO9a and NrasG12D. Loss of p53 also accelerates AML1/ETO9a + Nras-induced leukemogenesis.
Figure 6.
Figure 6.
Loss of p53 induces chemotherapy resistance in AML1/ETO9a + Nras AML. (A) Luciferase imaging of AML1/ETO9a + Nras leukemias generated in wild-type (left panel) or p53−/− (right panel) FLCs before (d0), during (d3), and after (d6, d24) chemotherapy. Recipient mice of p53-deficient AML1/ETO9a + Nras leukemias retain bioluminescent signal under therapy. (B) Hematoxylin–eosin-stained bone marrow sections of recipients of p53-deficient AML1/ETO9a + Nras leukemia at various time points following chemotherapy, demonstrating leukemia persistence during chemotherapy. Bars, 50 μm. (C) GFP histograms of bone marrow flow cytometry before (d0) and at various time points during (d3) and after (d6, d9) chemotherapy. While AML1/ETO9a + Nras blasts harboring wild-type p53 (AE + Nras p53 wt) rapidly clear, both MLL/ENL + Nras (ME + Nras p53 wt) and p53-deficient AML1/ETO9a + Nras leukemias (AE + Nras p53−/−) show persistence of GFP+ cells in bone marrow. (D) Kaplan-Meier survival curves of untreated and treated recipient mice of p53 wild-type and p53-deficient AML1/ETO9a + Nras leukemias. Loss of p53 impedes the long-term outcome of chemotherapy.

References

    1. Anensen N., Oyan A.M., Bourdon J.C., Kalland K.H., Bruserud O., Gjertsen B.T. A distinct p53 protein isoform signature reflects the onset of induction chemotherapy for acute myeloid leukemia. Clin. Cancer Res. 2006;12:3985–3992. - PubMed
    1. Byrd J.C., Mrozek K., Dodge R.K., Carroll A.J., Edwards C.G., Arthur D.C., Pettenati M.J., Patil S.R., Rao K.W., Watson M.S., et al. Pretreatment cytogenetic abnormalities are predictive of induction success, cumulative incidence of relapse, and overall survival in adult patients with de novo acute myeloid leukemia: Results from Cancer and Leukemia Group B (CALGB 8461) Blood. 2002;100:4325–4336. - PubMed
    1. Cozzio A., Passegue E., Ayton P.M., Karsunky H., Cleary M.L., Weissman I.L. Similar MLL-associated leukemias arising from self-renewing stem cells and short-lived myeloid progenitors. Genes & Dev. 2003;17:3029–3035. - PMC - PubMed
    1. Dai M., Wang P., Boyd A.D., Kostov G., Athey B., Jones E.G., Bunney W.E., Myers R.M., Speed T.P., Akil H., et al. Evolving gene/transcript definitions significantly alter the interpretation of GeneChip data. Nucleic Acids Res. 2005;33:e175. doi: 10.1093/nar/gni179. - DOI - PMC - PubMed
    1. Dennis G., Jr, Sherman B.T., Hosack D.A., Yang J., Gao W., Lane H.C., Lempicki R.A. DAVID: Database for annotation, visualization, and integrated discovery. Genome Biol. 2003;4:3. doi: 10.1186/gb-2003-4-5-p. - DOI - PubMed

Publication types

MeSH terms

Substances