. 2009 May 6;28(9):1319-31.
doi: 10.1038/emboj.2009.82. Epub 2009 Apr 2.

Mst1 controls lymphocyte trafficking and interstitial motility within lymph nodes

Affiliations

Mst1 controls lymphocyte trafficking and interstitial motility within lymph nodes

Koko Katagiri et al. EMBO J. .

Abstract

The regulation of lymphocyte adhesion and migration plays crucial roles in lymphocyte trafficking during immunosurveillance. However, our understanding of the intracellular signalling that regulates these processes is still limited. Here, we show that the Ste20-like kinase Mst1 plays crucial roles in lymphocyte trafficking in vivo. Mst1(-/-) lymphocytes exhibited an impairment of firm adhesion to high endothelial venules, resulting in an inefficient homing capacity. In vitro lymphocyte adhesion cascade assays under physiological shear flow revealed that the stopping time of Mst1(-/-) lymphocytes on endothelium was markedly reduced, whereas their L-selectin-dependent rolling/tethering and transition to LFA-1-mediated arrest were not affected. Mst1(-/-) lymphocytes were also defective in the stabilization of adhesion through alpha4 integrins. Consequently, Mst1(-/-) mice had hypotrophic peripheral lymphoid tissues and reduced marginal zone B cells and dendritic cells in the spleen, and defective emigration of single positive thymocytes. Furthermore, Mst1(-/-) lymphocytes had impaired motility over lymph node-derived stromal cells and within lymph nodes. Thus, our data indicate that Mst1 is a key enzyme involved in lymphocyte entry and interstitial migration.


Figures
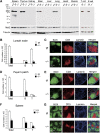
Figure 1
Figure 1
Hypoplastic lymphoid organs in Mst1-deficient mice. (A) Expression of Mst1 and Mst2 in organs of wild-type (+/+), Mst1flox/flox (f/f) and Cre+ Mst1flox/flox (−/−) mice. Tubulin served as a loading control. (B) Total and CD3+ and B220+ subset cell numbers in the inguinal lymph nodes. Total and subset numbers of axillary, popliteal, cervical and mesenteric lymph nodes in Mst1-deficient (−/−) mice were decreased to similar extents. n=5 for each, *P<0.001, **P<0.005, compared with the corresponding Mst1flox/flox (f/f) fractions. (C) Immunofluorescence staining of frozen tissue sections of axillary lymph nodes for B cells (B220; green), T cells (CD3; red) and laminin (blue). (D) Total and CD3+ and B220+ subset cell numbers in Peyer's patches. n=5 for each, *P<0.001, compared with the corresponding Mst1flox/flox (f/f) fractions. (E) Immunofluorescence staining of frozen tissue sections of Peyer's patches for B cells (B220; green), T cells (CD3; red) and laminin (blue). (F) Total and CD3+ and B220+ subset cell numbers in spleens. n=5 for each, *P<0.01, **P<0.005, compared with the corresponding Mst1flox/flox (f/f) fractions. (G) Immunofluorescence staining of frozen tissue sections of the spleen for B cells (B220; green), T cells (CD3; red) and laminin (blue).
Figure 2
Figure 2
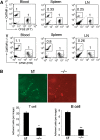
Defective homing of Mst1-deficient lymphocytes. (A) Adoptive transfer of T cells. T cells from Mst1flox/flox (f/f) and Mst1-deficient (−/−) mice were labelled with CFSE and CMTMR, respectively. They were mixed in equal numbers and injected into the tail veins of wild-type (Wt) mice. After 1 h, lymphocytes from the peripheral lymph nodes, spleen and blood were analysed by flow cytometry. Representative flow cytometry profiles of blood, lymph nodes, and spleen are shown. Numbers beside the boxed areas indicate the ratio of Mst1-deficient cells to Mst1flox/flox (f/f) cells (upper panel). Adoptive transfer of B cells. B cells from Mst1flox/flox (f/f) and Mst1-deficient (−/−) mice were similarly analysed as the T cells (lower panel). (B) Appearance of lymphocyte attachment to the HEV of the mesenteric lymph node. Intravital images of lymphocyte attachment to the HEV were taken 20 min after intravenous transfer of lymphocytes from Mst1flox/flox (f/f) (green) and Mst1-deficient (−/−) (red) mice (top). Representative images of three independent experiments are shown. The number of attached Mst1flox/flox (f/f) or Mst1−/− (−/−) T and B cells to the HEV. The number of attached cells were counted using images of more than five microscopic fields taken 30 min after cell transfer (bottom). Representative data of three independent experiments are shown. *P<0.01, **P<0.005, compared with the corresponding Mst1flox/flox (f/f) fractions. A full-colour version of this figure is available at The EMBO Journal Online.
Figure 3
Figure 3
Defective integrin-dependent stable adhesion of Mst1-deficient lymphocytes. (A) Time-displacement profiles of individual T-cell movement over LS12 endothelial monolayers under shear flow. Primary T cells from control mice perfused at 2 dyne/cm2 on LS12 monolayers immobilized with CCL21. Representative profiles of the cellular displacements over time were shown in four categories (no interaction, rolling, tether, transient and stable arrest), as described in the text. (B) The noninteracting and rolling velocities of control T cells movements on LS12 in the presence of anti-L-selectin and anti-LFA-1 antibody. (C) Stopping time of Mst1flox/flox (f/f) or Mst1-deficient (−/−) T cells arrested on LS12 endothelial cells were shown. More than 100 cells were measured in three independent experiments, and representative distribution of stopping time is shown. (D) Effects of anti-L-selectin, anti-LFA-1, PTX and Mst1-deficiency on the interactions of T cells with LS12 endothelial cells. Control Mst1flox/flox (f/f) T cells were pretreated with anti-L-selectin, LFA-1 and pertussis toxin (PTX), as described in Materials and methods. Mst1flox/flox (f/f) T cells and Mst1-deficient (−/−) T cells perfused at 2 dyne/cm2 on LS12 monolayers, which was immobilized with CCL21. The adhesive events of >100 cells were measured and categorized as described in (A). Data represent the means and s.e.m. of three independent experiments. *P<0.001, compared with Mst1flox/flox (f/f) lymphocytes.
Figure 4
Figure 4
Defective stable adhesion and LFA-1 clustering in Mst1-deficient cells. (A) CCL21-stimulated T-cell adhesion (left) or CXCL12-stimulated B-cell adhesion (right) to ICAM-1. After incubation with 100 nM CCL21 or CXCL12 for 10 min, shear stress-resistant adhesion was measured as described in Materials and methods. Data represent the means and s.e.m. of triplicate experiments. None, no stimulation. *P<0.001, compared with Mst1flox/flox (f/f) T cells stimulated with CCL21; **P<0.001, compared with Mst1flox/flox (f/f) B cells stimulated with CXCL12. (B) CCL21-stimulated T-cell adhesion (left) or CXCL12-stimulated B-cell adhesion (right) to VCAM-1. Shear stress-resistant adhesion was measured as described above. Data represent the mean and s.e.m. of triplicate experiments. None, no stimulation. *P< 0.002, compared with Mst1flox/flox (f/f) T cells stimulated with CCL21; **P<0.002, compared with Mst1flox/flox (f/f) B cells stimulated with CXCL12. (C) Redistribution of LFA-1 (red) and CD44 (green). Mst1flox/flox (f/f) and Mst1-deficient (−/−) T and B cells were stimulated with CCL21 or CXCL12 for 5 min, then fixed and analysed by confocal microscopy quantitatively for cells showing a polarized distribution of LFA-1 and CD44 (top). Representative cell morphology and distribution of LFA-1 and CD44 (bottom). Data represent the means and s.e.m. of triplicate experiments. *P<0.001, compared with Mst1flox/flox (f/f) lymphocytes. (D) Confocal microscopic analysis of LFA-1 and talin distribution of T cells from Mst1flox/flox (f/f) (left panel, upper) and Mst1-deficient (−/−) (left panel, bottom) mice. T cells were incubated on cover glass coated with ICAM-1 in the presence of CCL21 for 5 min, and then fixed and stained for LFA-1 and talin. DAPI was used for nuclear staining. A series of Z-stack images at 1-μm intervals from the glass surface are shown above (left panels). Right panels showed the LFA-1 and talin distribution on contact sites of Mst1flox/flox (f/f) and Mst1-deficient (−/−) T cells on ICAM-1.
Figure 5
Figure 5
Deficient numbers of MZB cells and dendritic cells in the spleen of Mst1−/− mice. (A) Flow cytometry profiles of B220+ splenic B cells from Mst1flox/flox (f/f) and Mst1-deficient (−/−) mice stained with anti-CD21 and anti-CD23. The numbers beside the boxed areas indicate the percentages of CD21hiCD23low MZB cells, CD21hiCD23hi mature B cells and CD21CD23 immature B cells of the total number of B220+ cells. (B) Spleen sections stained with IgM (green), IgD (red) and laminin (blue). IgMhi and IgD marginal zone B cells were not observed in Mst1-deficient mice (bottom). (C) Total splenic DCs and numbers of splenic DCs in the CD8+, CD8CD4, CD8CD4+ subsets. *P<0.002, compared with corresponding Mst1flox/flox (f/f) fractions. (D) Immunofluorescence staining of frozen tissue sections of Mst1f/f and Mst1−/− spleens for B cells (B220; green), DCs (CD11c; red) and laminin (blue). (E) Impaired DC trafficking from skin to draining lymph node. Epidermal sheets from Mst1flox/flox and Mst1-deficient mice stained with anti-MHC class II (upper, left panel). The number of skin-derived DCs migrated to lymph nodes after painting of shaved abdomens of Mst1flox/flox and Mst1-deficient mice with 1% FITC (lower, left panel). Data represent the absolute number of FITC+MHC class IIhigh cells that appeared in draining lymph nodes (axillary and inguinal). N=3; *P<0.005. Representative flow cytometry profiles are presented in right panel.
Figure 6
Figure 6
Decreased thymocyte emigration in Mst1-deficient mice. (A) Total and CD3+ and B220+subset cell numbers in the peripheral blood of Mst1flox/flox (f/f) and Mst1-deficient (−/−) mice. *P<0.03, compared with Mst1flox/flox (f/f) T lymphocytes. (B) Total, CD4+CD8+ double-positive (DP), CD4+ or CD8+ single-positive cells in thymi from Mst1flox/flox (f/f) and Mst1-deficient (−/−) mice. *P<0.05, compared with the corresponding fractions. (C) CD4 and CD8 flow cytometry profiles of thymi from Mst1flox/flox (f/f) and Mst1-deficient (−/−) mice. The numbers beside the boxed areas indicate the percentages. (D) Emigration of thymocytes towards CCL19 from thymic lobes. Thymic lobes from Mst1flox/flox (f/f) or Mst1-deficient (−/−) mice were put in the upper chamber of transwell chemotactic chambers. CD4 and CD8 profiles of cells recovered from the lower chamber containing CCL19 were measured after 3 h (left), and the total numbers of emigrated cells (right) are shown. *P<0.001, compared with Mst1flox/flox (f/f) single-positive cells.
Figure 7
Figure 7
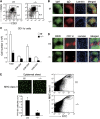
Defective interstitial migration of Mst1-deficient T and B cells. (A) Cell motility over monolayers of the BLS12 FRC cell line. Representative tracks of Mst1flox/flox (f/f) and Mst1−/− (−/−) T-cell blasts (left) and B-cells blast (right) over BLS12 cells as indicated (top). Each line represents a single cell track. Displacements and velocities of Mst1flox/flox (f/f) and Mst1-deficient (−/−) T and B cells (bottom). Sixty cells of each type were tracked for 10 min for each data set. The velocity data were obtained from movements every 30 s. *P<0.001, **P<0.05, compared with Mst1flox/flox (f/f) lymphocytes. (B) Multi-photon microscopic analysis of Mst1flox/flox (f/f) and Mst1-deficient (−/−) lymphocyte migration within LN explants. Representative tracks of Mst1flox/flox (f/f) T cells (red) and Mst1-deficient (−/−) T cells (green) are shown. Each line represents a single T-cell track (left). Velocities and displacements of Mst1flox/flox (f/f) and Mst1-deficient T cells (−/−) (right). Sixty-five cells of each type were tracked for each data set. *P<0.001, compared with Mst1flox/flox (f/f) T cells. (C) Multi-photon microscopic analysis of Mst1flox/flox (f/f) and Mst1-deficient (−/−) B-cell migration as in (B). Representative tracks of Mst1flox/flox (f/f) B cells (red) and Mst1-deficient (−/−) B cells (green). Each line represents a single B-cell track (left). Velocities and displacements of Mst1flox/flox (f/f) and Mst1-deficient B cells (−/−) (right). Fifty-two cells of each type were tracked for each data set. *P<0.001, compared with Mst1flox/flox (f/f) B cells. A full-colour version of this figure is available at The EMBO Journal Online.

Similar articles

Cited by

References

    1. Alon R, Feigelson S (2002) From rolling to arrest on blood vessels: leukocyte tap dancing on endothelial integrin ligands and chemokines at sub-second contacts. Semin Immunol 14: 93–104 - PubMed
    1. Bajenoff M, Egen JG, Koo LY, Laugier JP, Brau F, Glaichenhaus N, Germain RN (2006) Stromal cell networks regulate lymphocyte entry, migration, and territoriality in lymph nodes. Immunity 25: 989–1001 - PMC - PubMed
    1. Bergmeier W, Goerge T, Wang HW, Crittenden JR, Baldwin AC, Cifuni SM, Housman DE, Graybiel AM, Wagner DD (2007) Mice lacking the signaling molecule CalDAG-GEFI represent a model for leukocyte adhesion deficiency type III. J Clin Invest 117: 1699–1707 - PMC - PubMed
    1. Bos JL, de Rooij J, Reedquist KA (2001) Rap1 signaling: adhering to new models. Nat Rev 2: 369–377 - PubMed
    1. Bousso P, Robey E (2003) Dynamics of CD8+ T cell priming by dendritic cells in intact lymph nodes. Nat Immunol 4: 579–585 - PubMed

Publication types

MeSH terms