. 2009 May 20;28(10):1418-28.
doi: 10.1038/emboj.2009.88. Epub 2009 Apr 4.

ChIP-Seq of ERalpha and RNA polymerase II defines genes differentially responding to ligands

Affiliations

ChIP-Seq of ERalpha and RNA polymerase II defines genes differentially responding to ligands

Willem-Jan Welboren et al. EMBO J. .

Abstract

We used ChIP-Seq to map ERalpha-binding sites and to profile changes in RNA polymerase II (RNAPII) occupancy in MCF-7 cells in response to estradiol (E2), tamoxifen or fulvestrant. We identify 10 205 high confidence ERalpha-binding sites in response to E2 of which 68% contain an estrogen response element (ERE) and only 7% contain a FOXA1 motif. Remarkably, 596 genes change significantly in RNAPII occupancy (59% up and 41% down) already after 1 h of E2 exposure. Although promoter proximal enrichment of RNAPII (PPEP) occurs frequently in MCF-7 cells (17%), it is only observed on a minority of E2-regulated genes (4%). Tamoxifen and fulvestrant partially reduce ERalpha DNA binding and prevent RNAPII loading on the promoter and coding body on E2-upregulated genes. Both ligands act differently on E2-downregulated genes: tamoxifen acts as an agonist thus downregulating these genes, whereas fulvestrant antagonizes E2-induced repression and often increases RNAPII occupancy. Furthermore, our data identify genes preferentially regulated by tamoxifen but not by E2 or fulvestrant. Thus (partial) antagonist loaded ERalpha acts mechanistically different on E2-activated and E2-repressed genes.


Figures
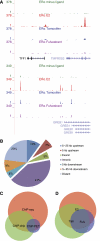
Figure 1
Figure 1
Overview of ERα-interaction sites. (A) ERα-binding sites at the TFF1 and GREB1 loci. The maximum number of overlapping tags, that is peak height is shown. Clear ERα peaks are detected in the promoter and enhancer region of the TFF1 and GREB1 gene on E2 treatment, whereas residual binding is observed in the absence of ligand. ERα binding is strongly decreased although not completely abolished on treatment with tamoxifen or fulvestrant compared with E2. (B) Genomic location of ERα-interaction sites. The majority of sites (41%) are located within an intron or distal from a gene (23%); 7% is located in promoter regions. (C) Comparison of large-scale ChIP profiling data. Venn diagram of the overlap of ERα-binding sites as identified in this study or reported by Lin et al and Lupien et al. 3305 and 1089 of the ChIP-Seq interaction sites are overlapping with the Lupien et al and Lin et al analysis (57 and 88%, respectively). (D) Venn diagram of the overlap between ERα-binding sites induced on E2, tamoxifen and fulvestrant treatment. The E2 and tamoxifen profile overlap to a large extent, but also contain preferential binding sites. Fulvestrant-liganded ERα interacts with a small number of sites that largely overlap with those found on E2 or tamoxifen induction.
Figure 2
Figure 2
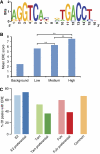
ERE motif and correlation with peak height. (A) The weight matrix of the highly overrepresented ERE motif. (B) Correlation of peak height with ERα motif score. The mean ERE motif score was determined using ERscan. ERα-interaction sites were binned according to peak height; random genomic regions were used as background. A clear positive correlation is obtained between the height of an ERα peak and the motif score. The mean of the motif scores in the three bins is significantly different as assessed by the Mann–Whitney test, with a P-value of <0.01, indicated by a double asterisk (C) Percentage of interaction sites containing an ERE. The different binding site profiles were searched for the presence of an ERE using ERscan. The ‘E2 preferential' group contains the highest percentage of ERE motifs as compared with the tamoxifen and fulvestrant preferential groups.
Figure 3
Figure 3
RNA polymerase II occupancy at ERα target genes. The RNAPII occupancy is depicted for the TFF1 (top panel) and GREB1 locus (lower panel) in response to solvent (green) or E2 (red).
Figure 4
Figure 4
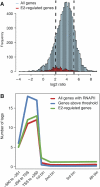
Promoter proximal enrichment of RNAPII (PPEP). (A) Histogram of the RNAPII occupancy ratio at promoter versus gene body. The distribution of the promoter/gene body ratio of all genes containing RNAPII (light blue) and of E2-responsive genes (red). The dashed lines represent the mean±1 × s.d. The 1228 genes display paused RNAPII of which only 21 are E2-responsive genes. (B) RNAPII occupancy profile. Genes were divided into bins relative to the transcription start site; −500 to −251, −250 to TSS, TSS to +250 and the remaining gene body was divided into four equal bins. For each group of genes, the mean number of tags per bin is plotted. E2-regulated genes on average have less RNAPII at their promoter regions as compared with the mean of all genes. Genes above the set threshold (mean+1 × s.d.) have a higher RNAPII occupancy at their promoter as compared with all genes and E2-regulated genes.
Figure 5
Figure 5
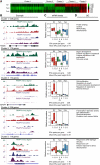
Cluster analysis based on changes in RNAPII occupancy. (A) The 1256 genes with changed RNAPII occupancy in response to the various ligands were clustered into five groups on the basis of the change in RNAPII occupancy relative to ‘no ligand' (ligand/no ligand ratio) using K-means clustering. (B) Representative examples of RNAPII occupancy in response to the various ligands. The number of genes in each cluster is indicated. (C) Boxplot presentation of the changes in mRNA levels triggered by ligand treatment for 1, 3 and 8 h of RT–qPCR analysis was performed on six randomly chosen genes out of each cluster using exonic primer pairs. Relative mRNA levels were normalized to that of RPS19. The number of ERα peaks and the mean ERα peak height is indicated. (D) Enriched GO categories in each cluster.

Similar articles

Cited by

References

    1. Ali S, Coombes RC (2002) Endocrine-responsive breast cancer and strategies for combating resistance. Nat Rev Cancer 2: 101–112 - PubMed
    1. Anderson E (2002) The role of oestrogen and progesterone receptors in human mammary development and tumorigenesis. Breast Cancer Res 4: 197–201 - PMC - PubMed
    1. Belandia B, Orford RL, Hurst HC, Parker MG (2002) Targeting of SWI/SNF chromatin remodelling complexes to estrogen-responsive genes. EMBO J 21: 4094–4103 - PMC - PubMed
    1. Bieda M, Xu X, Singer MA, Green R, Farnham PJ (2006) Unbiased location analysis of E2F1-binding sites suggests a widespread role for E2F1 in the human genome. Genome Res 16: 595–605 - PMC - PubMed
    1. Cannings E, Kirkegaard T, Tovey SM, Dunne B, Cooke TG, Bartlett JM (2007) Bad expression predicts outcome in patients treated with tamoxifen. Breast Cancer Res Treat 102: 173–179 - PubMed

Publication types