. 2009 Apr;26(4):847-61.
doi: 10.1364/josaa.26.000847.

Relationship between threshold and suprathreshold perception of position and stereoscopic depth

Affiliations

Relationship between threshold and suprathreshold perception of position and stereoscopic depth

Saumil S Patel et al. J Opt Soc Am A Opt Image Sci Vis. 2009 Apr.

Abstract

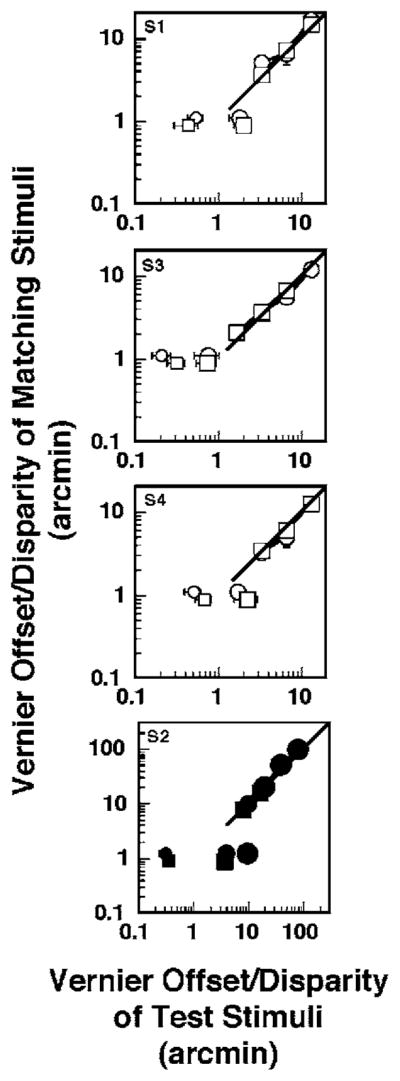
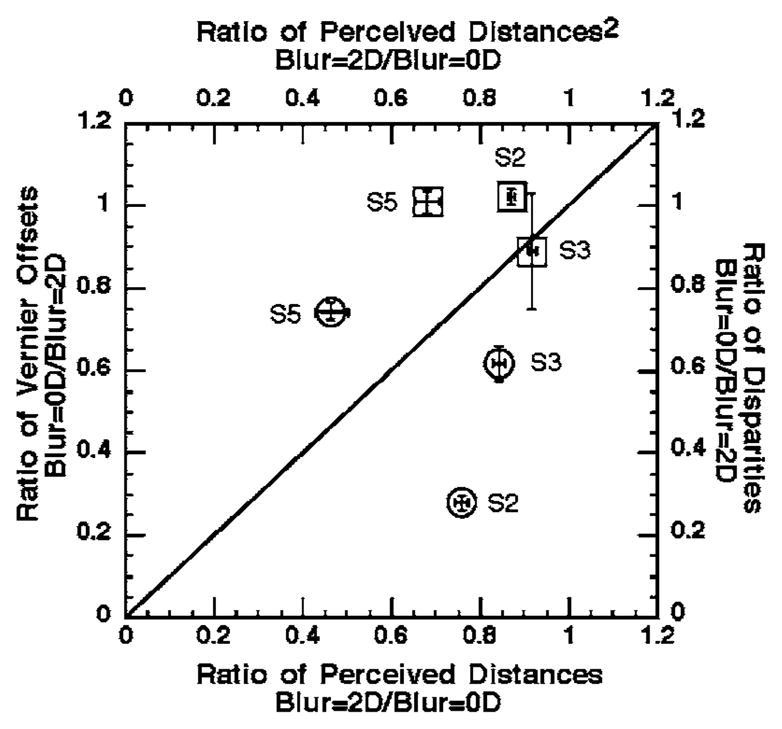
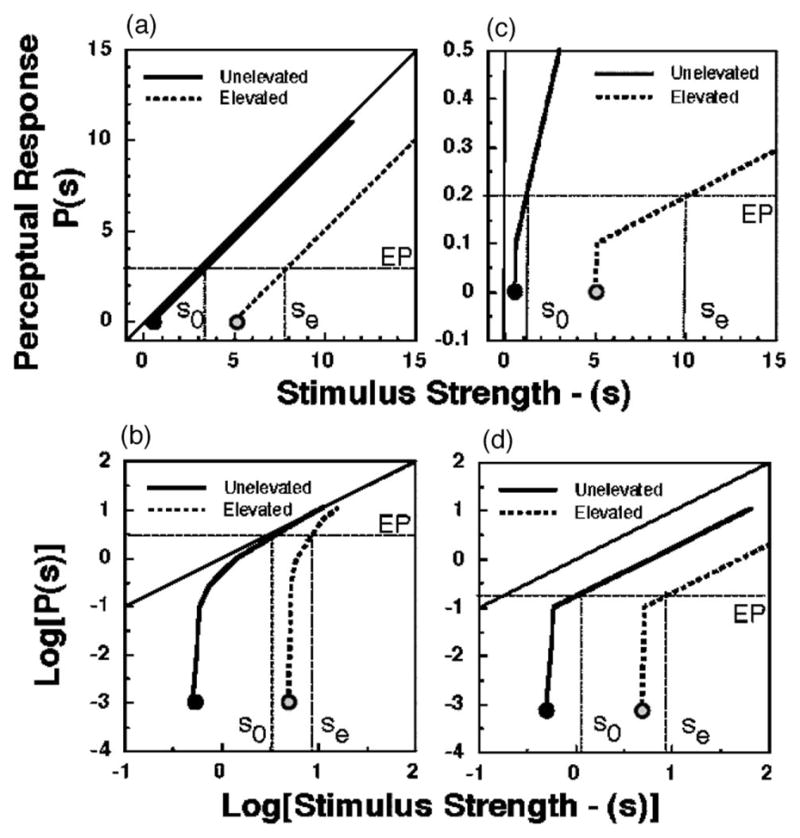
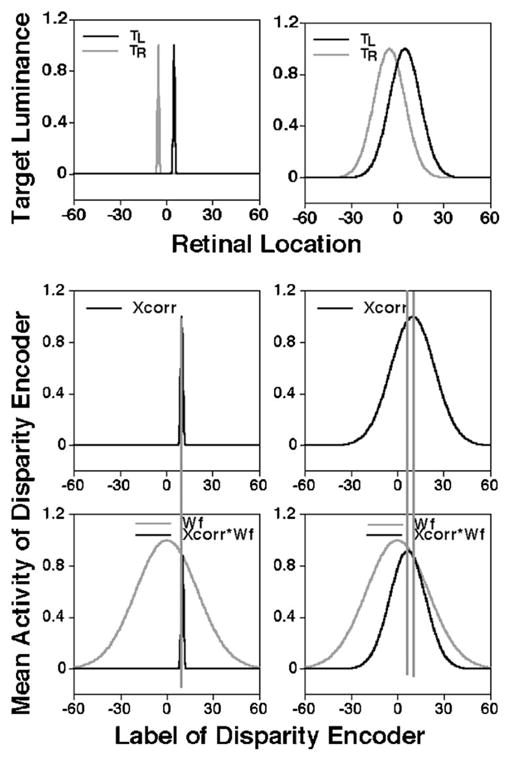
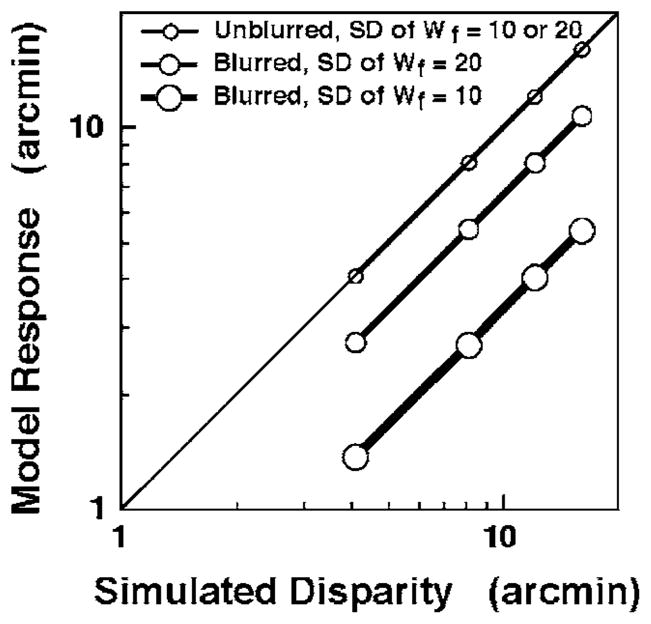
We seek to determine the relationship between threshold and suprathreshold perception for position offset and stereoscopic depth perception under conditions that elevate their respective thresholds. Two threshold-elevating conditions were used: (1) increasing the interline gap and (2) dioptric blur. Although increasing the interline gap increases position (Vernier) offset and stereoscopic disparity thresholds substantially, the perception of suprathreshold position offset and stereoscopic depth remains unchanged. Perception of suprathreshold position offset also remains unchanged when the Vernier threshold is elevated by dioptric blur. We show that such normalization of suprathreshold position offset can be attributed to the topographical-map-based encoding of position. On the other hand, dioptric blur increases the stereoscopic disparity thresholds and reduces the perceived suprathreshold stereoscopic depth, which can be accounted for by a disparity-computation model in which the activities of absolute disparity encoders are multiplied by a Gaussian weighting function that is centered on the horopter. Overall, the statement "equal suprathreshold perception occurs in threshold-elevated and unelevated conditions when the stimuli are equally above their corresponding thresholds" describes the results better than the statement "suprathreshold stimuli are perceived as equal when they are equal multiples of their respective threshold values."


Figures

Fig. 1
Fig. 1
(a) For the stimuli used in the position-offset experiments (top), the horizontal distance p between the vertical dotted lines is defined as the Vernier offset. In the fused percept (bottom), the observer sees the bottom line shifted rightward relative to the top line, with both lines in the same depth plane. (b) The stimuli used in the stereoscopic depth experiments (top) differed from those in (a) in that opposite directions of monocular offsets were presented to each eye to generate stereoscopic disparity. Twice the horizontal distance between the vertical dotted lines (2p) is defined as the relative stereoscopic disparity. In the fused percept (bottom), the observer sees the bottom line in front of (or behind) the top line, with both lines in the same perceived direction.
Fig. 2
Fig. 2
Threshold and matching data from the gap experiments for four observers. In each panel, the squares are data from the Vernier offset experiments and the circles are data from the stereo experiments. The error bars represent ±1 standard error. The unconnected square and circular symbols just below and above the y axis value of 1 in each panel represent the Vernier offset threshold and stereothreshold, respectively. The y axis value for the threshold data was selected arbitrarily. Small symbols correspond to thresholds for a 10′ interline gap (except S2’s gap=20′), medium-sized symbols correspond to thresholds for a 100′ gap (except S2’s gap=720′ and 240′ for Vernier offset and stereo-threshold experiments, respectively), and the large filled circle in the lower right panel corresponds to S2’s stereo threshold for a 540′ gap. The squares and circles joined by lines are data from suprathreshold Vernier offset and stereo experiments, respectively. The 1:1 diagonal line represents equal suprathreshold perception of the test and matching stimuli in the threshold unelevated and elevated conditions. The filled symbols for S2 denote that the gap of the matching stimuli in the Vernier offset and stereo suprathreshold experiments was 20′.
Fig. 3
Fig. 3
Threshold and matching data from the blur experiments for three observers. The unfilled symbols indicate that the test target was blurred by +2 D. Otherwise, the lines and symbols have the same meaning as in Fig. 2. The interline gap was 20′. For observer S3 a test target with 4 D blur also was used (filled symbols).
Fig. 4
Fig. 4
Relationship between blur-induced changes in perceived target distance and perceived position-offset (squares) or stereoscopic depth (circles). The top x axis and the right-hand y axis compare the ratio of the squared perceived distances for blurred versus unblurred targets to the ratio of disparities for unblurred matching and blurred test stimuli, averaged for all of the suprathreshold disparities in Fig. 3. The bottom x axis and left-hand y axis compare the ratio of perceived distances for blurred versus unblurred stimuli to the ratio of the Vernier position offsets for unblurred matching and blurred test stimuli, averaged for all the suprathreshold Vernier offsets in Fig. 3. Each symbol represents the data for one observer, with x and y error bars equal to ±1 SE. The diagonal line indicates that blur-induced changes in perceived stereoscopic depth or relative position offset can be accounted for by blur-induced changes in perceived distance.
Fig. 5
Fig. 5
Relationship between the threshold and the perception of suprathreshold stimuli as predicted by Kulikowski’s [(a) and (b)] and by proportional models [(c) and (d)] of suprathreshold perception. (a) and (c) plot stimulus strength s versus the perceptual response P(s) on linear x and y axes. (b) and (d) replot the same relationships on logarithmic x and y axes. In each plot, the thick black line shows the relationship between stimuli and perceptual responses for stimulus levels above the unelevated threshold Th0 (black circle). In a threshold-elevating condition, the threshold increases to The (gray circle) and perceptual responses to stimuli greater than The are defined by the thick dotted line. In the model shown in (a) and (b), the perceptual responses EP in the normal and threshold-elevating conditions match when the suprathreshold stimuli in the corresponding conditions s0 and se differ by the amount equal to the difference between the thresholds (TheTh0). In the model shown in (c) and (d), the perceptual responses EP in the normal and threshold-elevating conditions match when the suprathreshold stimuli in the corresponding conditions s0 and se have a ratio equal to the ratio of the thresholds The/Th0. Note that the proportional model’s prediction in the logarithmic coordinate system is equivalent to the Kulikowski model’s prediction in a linear coordinate system.
Fig. 6
Fig. 6
(Color online) Evaluation of the Kulikowski (top row) and proportional models (bottom row) for suprathreshold perception, using data pooled across observers and conditions in the gap (left) and blur (right) position-offset experiments. The x axis in each panel represents the difference between the suprathreshold position offset and the threshold Vernier offset (linear in the top panels and log transformed in the bottom panels) when the Vernier threshold was not elevated. The y axis represents the difference between the suprathreshold position offset and the elevated Vernier threshold in threshold-elevating conditions. Filled circles specify position offsets in the threshold-unelevated and elevated conditions that perceptually match. Solid lines are fit to the plotted data, with the y intercept constrained to be zero. In each panel, the prediction of the Kulikowski or the proportional model is shown by a dotted line.
Fig. 7
Fig. 7
(Color online) Evaluation of the Kulikowski (top row) and proportional models (bottom row) for suprathreshold perception using the data from the stereoscopic depth experiments. The x axis in each panel represents the difference between the suprathreshold disparity and the stereothreshold (linear in the top panels, log transformed in the bottom panels) when the stereothreshold was not elevated. The y axis represents the difference between the suprathreshold disparity and the elevated stereothreshold in threshold-elevating conditions. Other conventions are as in Fig. 6.
Fig. 8
Fig. 8
Illustration of the effect of stimulus blur and readout weighting on disparity representation. The top row illustrates the retinal activity profiles generated by one object of a binocular stimulus that is composed of two objects. The second object (not shown) is assumed to lie on the horopter with zero disparity. Activity profiles in the two eyes are represented as two Gaussian functions (curves TL and TR) displaced from the retinal zero location in opposite directions. The difference between the peaks of the two Gaussian functions represents the absolute stimulus disparity (here, 10′). The middle row shows the absolute disparity representation obtained by cross-correlating the retinal activity profiles in the two eyes in the top row. The gray Gaussian curves (Wf :SD=20′) in the bottom row depict a hypothetical weighted readout function for disparity, and the black curves represent the weighted disparity representation computed by multiplying the absolute disparity representation in the middle row by the weighted readout function. The left and right columns show the normalized retinal activation and the corresponding disparity representations for an unblurred (Gaussian SD=0.5′) and a blurred stimulus (Gaussian SD=10′), respectively. The long vertical dotted lines that span the second and third rows illustrate the relative alignment between the peaks of the disparity representation and the weighted disparity representation.
Fig. 9
Fig. 9
Simulation results for the weighted-disparity-computation model. The x axis represents the absolute disparity of an off-horoptoral binocular stimulus object. (The reference object is assumed to be on the horopter.) For each value of stimulus disparity on the x axis, the y axis represents the centroid of the weighted disparity representation obtained using a Gaussian weighting function Wf with its peak on the horopter as described in Fig. 8. Simulation results using two different weighting functions are shown for blurred (medium and large circles connected by slightly thick and thicker lines, respectively) and unblurred stimuli (small circles and thin connecting line). The standard deviation SD of the Gaussian retinal activity profile for the blurred stimulus was 10′. The thin diagonal line indicates veridical model responses.

Similar articles

Cited by

References

    1. Fechner GT. Elemente der Psychophysik. Breitkopf and Hartel; 1860.
    1. Green DM, Swets JA. Signal Detection Theory and Psychophysics. Krieger; 1974.
    1. Georgeson MA, Sullivan GD. J Physiol. Vol. 252. London: 1975. Contrast constancy: deblurring in human vision by spatial frequency channels; pp. 627–656. - PMC - PubMed
    1. Swanson WH, Wilson HR, Giese SC. Contrast matching data predicted from contrast increment thresholds. Vision Res. 1984;24:63–75. - PubMed
    1. Georgeson MA. Temporal properties of spatial contrast vision. Vision Res. 1987;27:765–780. - PubMed

Publication types