. 2009 Mar;59(2):87-96.
doi: 10.1007/s12576-008-0012-8. Epub 2008 Dec 26.

Reduced volume-regulated outwardly rectifying anion channel activity in ventricular myocyte of type 1 diabetic mice

Affiliations

Reduced volume-regulated outwardly rectifying anion channel activity in ventricular myocyte of type 1 diabetic mice

Shintaro Yamamoto et al. J Physiol Sci. 2009 Mar.

Abstract

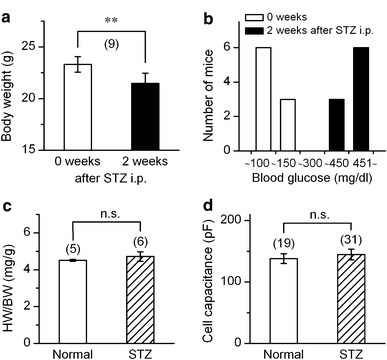
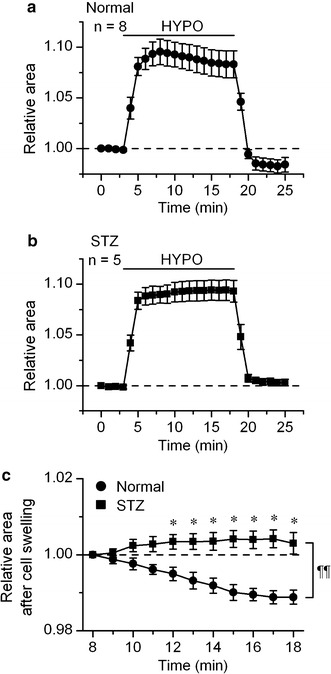
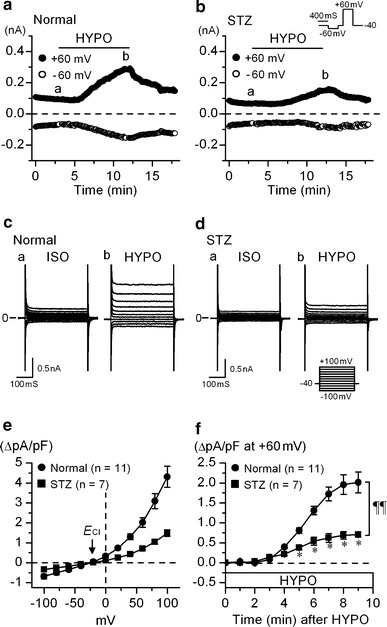
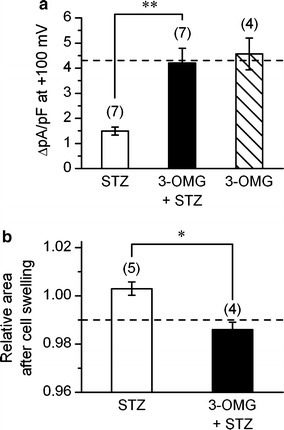
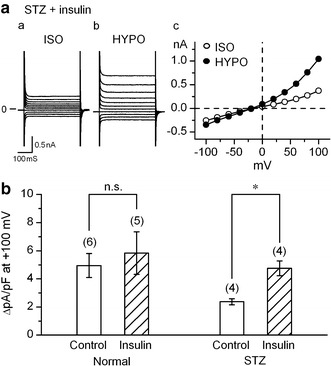
The currents through the volume-regulated outwardly rectifying anion channel (VRAC) were measured in single ventricular myocytes obtained from streptozotocin (STZ)-induced diabetic mice, using whole-cell voltage-clamp method. In myocytes from STZ-diabetic mice, the density of VRAC current induced by hypotonic perfusion was markedly reduced, compared with that in the cells form normal control mice. Video-image analysis showed that the regulatory volume decrease (RVD), which was seen in normal cells after osmotic swelling, was almost lost in myocytes from STZ-diabetic mice. Some mice were pretreated with 3-O-methylglucose before STZ injection, to prevent the STZ's beta cell toxicity. In the myocytes obtained from such mice, the magnitude of VRAC current and the degree of RVD seen during hypotonic challenge were almost normal. Incubation of the myocytes from STZ-diabetic mice with insulin reversed the attenuation of VRAC current. These findings suggested that the STZ-induced chronic insulin-deficiency was an important causal factor for the attenuation of VRAC current. Intracellular loading of the STZ-diabetic myocytes with phosphatidylinositol 3,4,5-trisphosphate (PIP3), but not phosphatidylinositol 4,5-bisphosphate (PIP2), also reversed the attenuation of VRAC current. Furthermore, treatment of the normal cells with wortmannin, a phosphatidylinositol 3-kinase (PI3K) inhibitor, suppressed the development of VRAC current. We postulate that an impairment PI3K-PIP3 pathway, which may be insulin-dependent, is responsible for the attenuation of VRAC currents in STZ-diabetic myocytes.


Figures

Fig. 1
Fig. 1
General characteristics of STZ-induced mice. a Mean data showing body-weight of mice measured before (0 week) and 2 weeks after STZ treatment. **Significantly different with P < 0.01 according to a paired t-test. b Distribution of blood glucose level (mg dl−1) among the normal control mice (0 week) and those treated with STZ (2 weeks). c and d comparison of the ratio of heart-weight and body-weight (c), and the cell capacitance of ventricular myocyte (d). Cells were obtained from the mice 2 weeks after STZ treatment (STZ) or from the age-matched un-treated mice (normal). Number in parentheses indicates number of animals (a and c) or number of cells examined (d). n.s., no significant difference
Fig. 2
Fig. 2
Hypotonicity-induced swelling of ventricular myocyte from normal and STZ-diabetic mice. a and b, time course of change of the relative cell area observed in the myocytes of normal (a) and STZ-diabetic (b) mice exposed to hypotonic (HYPO) solutions. The cells were initially bathed in isotonic solution, and then hypotonic (HYPO) solution was applied during the period indicated by bar. The values are expressed as relative to those obtained before application of hypotonic solution. c Shows an expanded illustration of a part of a (filled circle) and b (filled square). The values are expressed as relative to those obtained 5 min after application of hypotonic solution. *Significantly larger than the time-matched control data with P < 0.05 according to an unpaired t-test. A comparison of curves with repeated measures ANOVA yielded P < 0.01 (¶¶)
Fig. 3
Fig. 3
Activation of whole cell currents by hypotonic solutions in ventricular myocyte from normal and STZ-diabetic mice. a, b Time course of activation of VRAC currents at +60 mV (filled circle) and −60 mV (circle) observed in the myocytes of normal (a) and STZ-diabetic (b) mice exposed to hypotonic (HYPO) solutions. [Cl]o/[Cl]i ratio was constantly 105 mM/45 mM with which the predicted equilibrium potential (E Cl) was −21 mV. The cells were initially bathed in isotonic solution (ISO), and then hypotonic (HYPO) solution was applied during the period indicated by bar. The pulse protocol is shown in the upper part of b. c and d Recordings of membrane currents in myocytes from normal (c) and STZ-diabetic mice (d) in isotonic and hypotonic solutions, respectively. Currents were recorded by applying 400 ms voltage-clamp steps to membrane potentials between −100 and +100 mV in +20 mV steps from a holding potential of −40 mV every 6 s, at the time points (a and b) indicated in a and b. e The mean I–V relationships of the difference current between the current in HYPO and that in ISO (a, b in c and d), obtained in myocyte from normal (filled circle) and STZ-diabetic (filled square) mice. Arrow indicates the predicted Cl equilibrium potential. f Mean time course of activation of VRAC current at +60 mV after hypotonic solutions, in myocytes from normal (filled circle) and STZ-diabetic mice (filled square). In this plot, the current level at the beginning of hypotonic perfusion (0 min) was set to be 0. Abscissa, time after exposure to hypotonic solution. *Significantly smaller than the control value at matched time point with P < 0.05 according to an unpaired t-test. A comparison of curves with repeated measures ANOVA yielded P < 0.01 (¶¶)
Fig. 4
Fig. 4
Prevention by 3-OMG of STZ-induced suppression of cardiac VRAC current. a and b Mean density of VRAC current (difference current) measured at +100 mV (a) and cell area (b), observed after 15 min of hypotonic perfusion. The currents and cell area were measured in the myocytes from STZ-diabetic mice (STZ), and those from the mice pretreated with 3-OMG before STZ injection (3-OMG + STZ). In a, the density of VRAC current observed in cells from the mice treated with 3-OMG alone is also shown. **Significantly different with P < 0.01, according to one-way ANOVA with post-hoc test In b, the values are expressed as relative to those obtained 5 min after application of hypotonic solution. Dashed line in a and b indicates the control level derived from the data in Fig. 3e (filled circle) and Fig. 2c (filled circle), respectively. *Significantly different with P < 0.05 according to an unpaired t-test. Number in parentheses indicates number of cells examined
Fig. 5
Fig. 5
Effects of insulin on VRAC currents in ventricular myocytes from STZ-diabetic mice. a recordings of whole cell currents in myocytes from STZ-diabetic mice, obtained after ~6 h exposure to 100 nM insulin. Currents were recorded in isotonic (a, ISO) and hypotonic (b, HYPO) solutions with the same voltage steps as in Fig. 3d, and c shows their I–V relationships. b Magnitude of VRAC currents at +100 mV observed in the cells derived from normal (Normal) and STZ-diabetic mice (STZ) with and without insulin treatment. The cells were incubated at 37°C for 5–8 h, in the modified Tyrode solution without (Control) or with 100 nM insulin. *Significantly larger than control with P < 0.05, according to one-way ANOVA with post-hoc test. Number in parentheses indicates number of cells examined
Fig. 6
Fig. 6
Effects of PIP3 loading on VRAC currents in ventricular myocytes from STZ-diabetic mice. a and b, Recordings of membrane currents in myocytes from STZ-diabetic mice in isotonic (ISO) and hypotonic (HYPO) solutions. The cells were loaded with PIP2 (a) or PIP3 (b). Voltage pulses were applied as in Fig. 3c and d. c Mean I–V relationships of VRAC current in ventricular myocyte from STZ-diabetic mice dialyzed with PIP2 (circle, n = 5) or PIP3 (filled circle, n = 5). In this series of experiments, pipette solution contained 10 μM of PIP2 or PIP3, and the current recordings were begun ~ 30 min after the membrane rupture, for more complete cell dialysis. d Mean time course of activation of VRAC current at +60 mV after hypotonic solutions, in STZ-diabetic myocyte dialyzed with PIP2 (circle) and PIP3 (filled circle). In this plot, the current level at the beginning of hypotonic perfusion (0 min) was set to be 0. Abscissa, time after exposure to hypotonic solution. *Significantly smaller than the control value at matched time point with P < 0.05 according to an unpaired t-test. A comparison of curves with repeated measures ANOVA yielded P < 0.01 (¶¶). e Mean density of VRAC current at +100 mV obtained under different conditions. Currents were measured in cells from normal and STZ-diabetic mice, with intracellular PIP2 or PIP3, respectively. f Mean density of VRAC current at +100 mV in normal (Normal) and STZ-diabetic (STZ) myocytes incubated with wortmannin (100 nM) for 5–8 h. In e and f, dashed line indicates the control level derived from the data in Fig. 3e (filled circle). * and **Significantly smaller than control with P < 0.05 and 0.01, respectively, according to one-way ANOVA with post-hoc test. Number in parentheses indicates number of cells examined

Similar articles

Cited by

References

    1. McNally PG, Lawrence IG, Panerai RB, Weston PJ, Thurston H. Sudden death in type 1 diabetes. Diabetes Obes Metab. 1999;1:151–158. doi: 10.1046/j.1463-1326.1999.00025.x. - DOI - PubMed
    1. Cesario DA, Brar R, Shivkumar K. Alterations in ion channel physiology in diabetic cardiomyopathy. Endocrinol Metab Clin North Am. 2006;35:601–610. doi: 10.1016/j.ecl.2006.05.002. - DOI - PubMed
    1. Shehadeh A, Regan TJ. Cardiac consequences of diabetes mellitus. Clin Cardiol. 1995;18:301–305. doi: 10.1002/clc.4960180604. - DOI - PubMed
    1. Jourdon P, Feuvray D. Calcium and potassium currents in ventricular myocytes isolated from diabetic rats. J Physiol. 1993;470:411–429. - PMC - PubMed
    1. Nobe S, Aomine M, Arita M, Ito S, Takaki R. Chronic diabetes mellitus prolongs action potential duration of rat ventricular muscles: circumstantial evidence for impaired Ca2+ channel. Cardiovasc Res. 1990;24:381–389. doi: 10.1093/cvr/24.5.381. - DOI - PubMed

Publication types

MeSH terms