. 2009 Jan;59(1):37-47.
doi: 10.1007/s12576-008-0003-9. Epub 2008 Dec 6.

Gene structures, biochemical characterization and distribution of rat melatonin receptors

Affiliations

Gene structures, biochemical characterization and distribution of rat melatonin receptors

Hirotaka Ishii et al. J Physiol Sci. 2009 Jan.

Abstract

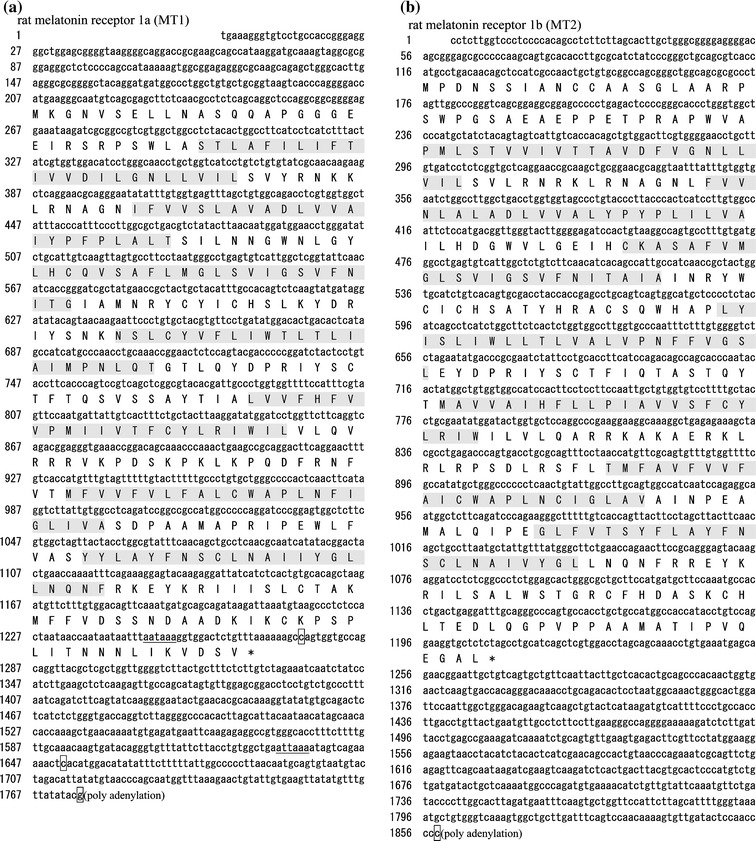
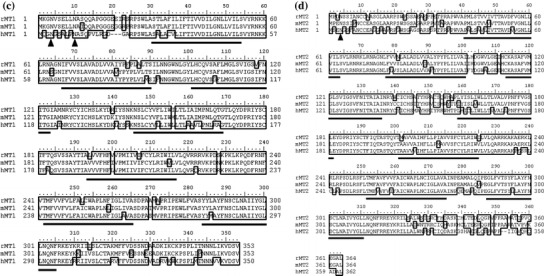
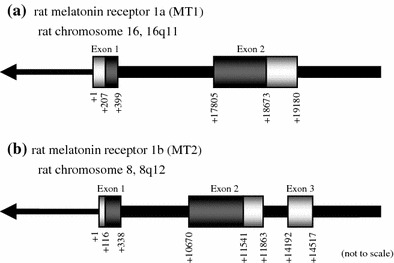
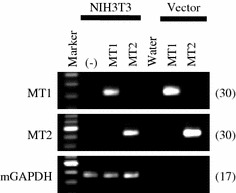
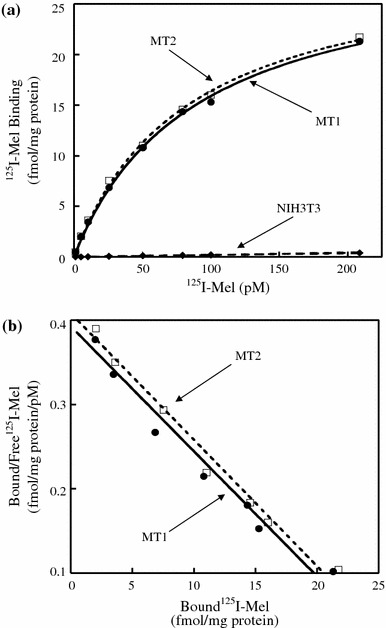
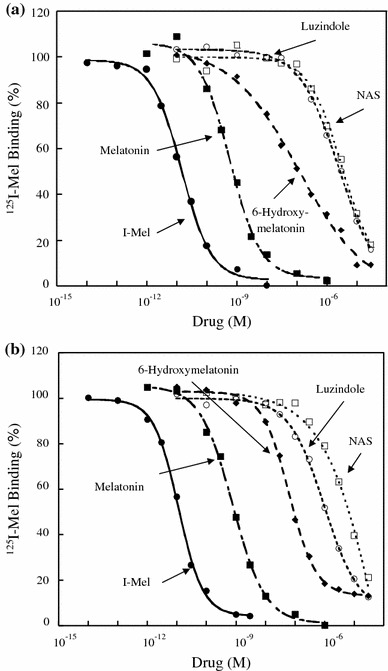
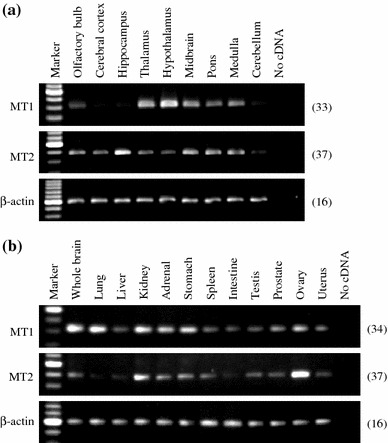
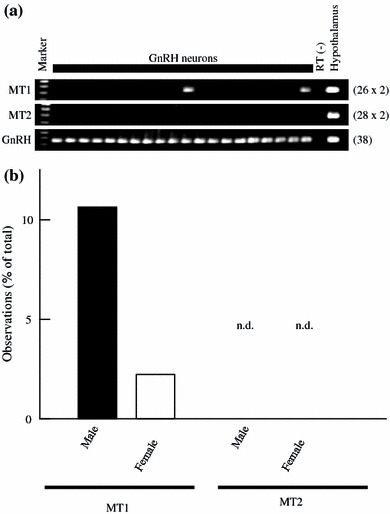
G-protein coupled receptors for the pineal hormone melatonin have been partially cloned from rats. However, insufficient information about their cDNA sequences has hindered studies of their distribution and physiological responses to melatonin using rats as an animal model. We have cloned cDNAs of two rat membrane melatonin receptor subtypes, melatonin receptor 1a (MT1) and melatonin receptor 1b (MT2), using a rapid amplification of cDNA end (RACE) method. The rat MT1 and MT2 cDNAs encode proteins of 353 and 364 amino acids, respectively, and show 78-93% identities with the human and mouse counterparts. Stable expression of either rat MT1 or MT2 in NIH3T3 cells resulted in high affinity 2-[(125)I]-iodomelatonin ((125)I-Mel) binding (K (d) = 73.2 +/- 9.0 and 73.7 +/- 2.9 pM, respectively), and exhibited a similar rank order of inhibition of specific (125)I-Mel binding by five ligands (2-iodomelatonin > melatonin > 6-hydroxymelatonin > luzindole > N-acetyl-5-hydroxytryptamine). RT-PCR analysis showed that MT1 is highly expressed in the hypothalamus, lung, kidney, adrenal gland, stomach, and ovary, while MT2 is highly expressed in the hippocampus, kidney, and ovary. We also performed multi-cell RT-PCR to examine the expression of mRNAs encoding MT1 and MT2 in adult GnRH neurons. MT1 was weakly expressed in male GnRH neurons, and was less expressed in the female neurons. MT2 expression was undetectable in GnRH neurons from either sex. This study delineates the gene structures, fundamental properties, and distribution of both rat melatonin receptor subtypes, and may offer opportunities to assess the physiological significance of melatonin in rats.


Figures

Fig. 1
Fig. 1
Structural analysis of rat melatonin receptor nucleotide and deduced amino acid sequences. cDNA sequences and deduced amino acid sequences of rat MT1 (a) and MT2 (b). The polyadenylation signals are underlined, and the polyadenylation sites are boxed. Shaded regions are transmembrane domains. We registered these two sequences as accession numbers AB377274 for rat MT1 and AB377275 for rat MT2. Alignments of the deduced rat MT1 (c) and MT2 (d) protein amino acid sequences with mouse and human counterparts. Identical amino acids are outlined. Solid lines and arrows indicate transmembrane domains and potential N-glycosylation sites, respectively. Genbank accession numbers referred are as follows: rat MT1 (rMT1), AB377274; mouse MT1 (mMT1), NM_008639; human MT1 (hMT1), NM_005958; rat MT2 (rMT2), AB377275; mouse MT2 (mMT2), AB377276; human MT1 (hMT2), NM_005959
Fig. 1
Fig. 1
Structural analysis of rat melatonin receptor nucleotide and deduced amino acid sequences. cDNA sequences and deduced amino acid sequences of rat MT1 (a) and MT2 (b). The polyadenylation signals are underlined, and the polyadenylation sites are boxed. Shaded regions are transmembrane domains. We registered these two sequences as accession numbers AB377274 for rat MT1 and AB377275 for rat MT2. Alignments of the deduced rat MT1 (c) and MT2 (d) protein amino acid sequences with mouse and human counterparts. Identical amino acids are outlined. Solid lines and arrows indicate transmembrane domains and potential N-glycosylation sites, respectively. Genbank accession numbers referred are as follows: rat MT1 (rMT1), AB377274; mouse MT1 (mMT1), NM_008639; human MT1 (hMT1), NM_005958; rat MT2 (rMT2), AB377275; mouse MT2 (mMT2), AB377276; human MT1 (hMT2), NM_005959
Fig. 2
Fig. 2
Genomic organization of rat MT1 and MT2. Schematic representation of rat MT1 (a) and MT2 (b) gene structures. cDNA sequences are mapped on rat genome version 3.4. The rat MT1 gene is located at 16q11 on rat chromosome 16, and consists of two exons. On the other hand, rat MT2 gene lies at 8q12 on rat chromosome 8, and consists of three exons. The white and gray boxes indicate the UTRs and ORFs, respectively. The arrows indicate the orientation of the chromosomes. The images are not to scale
Fig. 3
Fig. 3
RT-PCR analysis of rat MT1 and MT2 mRNA expression in NIH3T3 cell lines stably transfected with pcDNA6.2-rat MT1 or pcDNA6.2-rat MT2. We performed RT-PCR to confirm the stable expression of rat MT1 and MT2 in transfected NIH3T3 cells. Expression of MT1 (upper panel), MT2 (middle panel), and mouse GAPDH (mGAPDH) (lower panel). “(–)” indicates samples prepared from untransfected NIH3T3 cells. 0.1 ng of pcDNA6.2-rat MT1 or pcDNA6.2-rat MT2 vectors were used as positive controls. The number on the right of each panel indicates the number of PCR cycles performed
Fig. 4
Fig. 4
Scatchard analysis of specific 125I-Mel binding to cell lysates prepared from NIH3T3 cells stably expressing either rat MT1 or MT2. a 125I-Mel saturation binding to rat MT1 or MT2 in NIH3T3 cells. Cell lysates were incubated with various concentrations of 125I-Mel (1–200 pM). Non-specific binding was measured in the presence of 20 μM melatonin. Specific 125I-Mel binding is defined as total binding minus non-specific binding. b Scatchard plots of saturation binding to rat MT1 and MT2. The K d, B max, and Hill’s values depicted are 67.6 pM, 26.5 fmol/mg of whole cell protein, and 1.01 for rat MT1, and 66.7 pM, 27.2 fmol/mg, and 1.01 for rat MT2, respectively. Data shown are representative of four experiments. The K d, B max, and Hill’s values of four experiments are 73.2 ± 9.0 pM (mean ± SEM), 27.1 ± 2.7 fmol/mg, and 1.01 ± 0.02 for rat MT1, and 73.7 ± 2.9 pM, 30.0 ± 2.4 fmol/mg, and 1.00 ± 0.01 for rat MT2, respectively
Fig. 5
Fig. 5
Competition curves for inhibition of specific 125I-Mel binding by melatonin and its analogues in NIH3T3 cells stably expressing either rat MT1 or MT2. Cell lysates were incubated with 100 pM 125I-Mel and various concentrations of 2-iodomelatonin (I-Mel), melatonin, 6-hydroxymelatonin, luzindole, or N-acetyl-5-hydroxytryptamine (NAS). Non-specific binding was determined in the presence of 20 μM melatonin. Competition binding with various ligands in NIH3T3 cells transfected with either rat MT1 (a) or MT2 (b). The data shown are mean values of four experiments for each drug. The K i values are listed in Table 3
Fig. 6
Fig. 6
RT-PCR analysis of MT1 and MT2 mRNA expression in various brain subregions and peripheral organs. Total RNA isolated from various brain subregions and peripheral organs was subjected to RT-PCR using specific primers for MT1, MT2 and β-actin cDNAs. a Expression of MT1 (upper panel), MT2 (middle panel), and β-actin (lower panel) in rat brain subregions. b Expression of MT1 (upper panel), MT2 (middle panel) and β-actin (lower panel) in rat whole brain and peripheral organs. The number on the right of each panel indicates the number of PCR cycles performed. Similar patterns of expression were observed in three different samples
Fig. 7
Fig. 7
Multi-cell RT-PCR analysis of mRNAs encoding rat MT1 and MT2 in adult male and female rat GnRH neurons. Cytoplasmic contents harvested from five GnRH neurons were pooled and reverse-transcribed to generate cDNA. The amount of cDNA corresponding to two GnRH neurons was examined with each of the primer pairs for rat MT1 and MT2. For GnRH transcripts, the amount of cDNA corresponding to one GnRH neuron was used. a Representative gel images of MT1 (upper panel), MT2 (middle panel), and GnRH (lower panel) mRNA expression in adult male rat GnRH neurons. The gels show the presence of MT1 and GnRH. MT2 expression was not detectable. “RT (–)” indicates cytosol from GnRH neurons treated without reverse transcriptase. The number on the right of each panel indicates the number of PCR cycles performed. b Expression patterns of rat MT1 and MT2 mRNAs in adult male and female rat GnRH neurons. The appearance of positive bands in the multi-cell RT-PCR experiments is shown as a percentage of the total reactions for MT1 and MT2 (n = 47, 235 GnRH neurons for male; n = 45, 225 GnRH neurons for female). The bands for MT2 were not detectable (n.d.) in GnRH neurons. GnRH was positive in all reactions

Similar articles

Cited by

References

    1. Reiter RJ. Pineal melatonin: cell biology of its synthesis and of its physiological interactions. Endocr Rev. 1991;12:151–180. doi: 10.1210/edrv-12-2-151. - DOI - PubMed
    1. von Gall C, Stehle JH, Weaver DR. Mammalian melatonin receptors: molecular biology and signal transduction. Cell Tissue Res. 2002;309:151–162. doi: 10.1007/s00441-002-0581-4. - DOI - PubMed
    1. Witt-Enderby PA, Bennett J, Jarzynka MJ, Firestine S, Melan MA. Melatonin receptors and their regulation: biochemical and structural mechanisms. Life Sci. 2003;72:2183–2198. doi: 10.1016/S0024-3205(03)00098-5. - DOI - PubMed
    1. Reppert SM, Weaver DR, Ebisawa T. Cloning and characterization of a mammalian melatonin receptor that mediates reproductive and circadian responses. Neuron. 1994;13:1177–1185. doi: 10.1016/0896-6273(94)90055-8. - DOI - PubMed
    1. Reppert SM, Godson C, Mahle CD, Weaver DR, Slaugenhaupt SA, Gusella JF. Molecular characterization of a second melatonin receptor expressed in human retina and brain: the Mel1b melatonin receptor. Proc Natl Acad Sci USA. 1995;92:8734–8738. doi: 10.1073/pnas.92.19.8734. - DOI - PMC - PubMed

Publication types

MeSH terms