. 2009 Jun-Jul;44(6-7):426-33.
doi: 10.1016/j.exger.2009.03.005. Epub 2009 Mar 31.

Effects of aging and calorie restriction on rat skeletal muscle glycogen synthase and glycogen phosphorylase

Affiliations

Effects of aging and calorie restriction on rat skeletal muscle glycogen synthase and glycogen phosphorylase

Marta Montori-Grau et al. Exp Gerontol. 2009 Jun-Jul.

Abstract

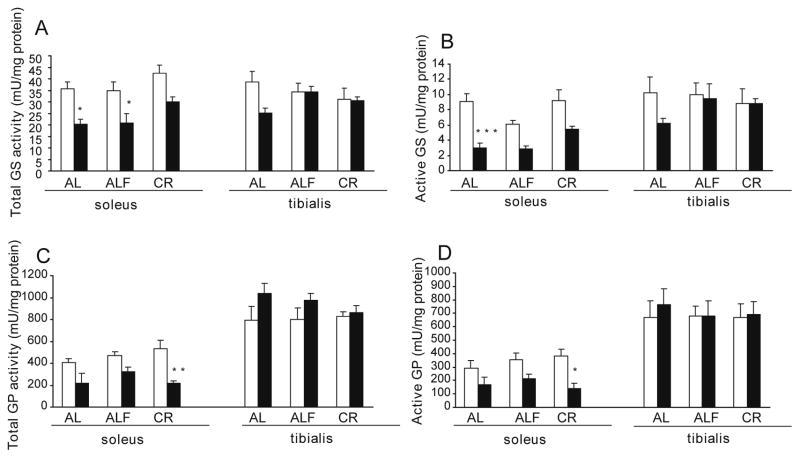
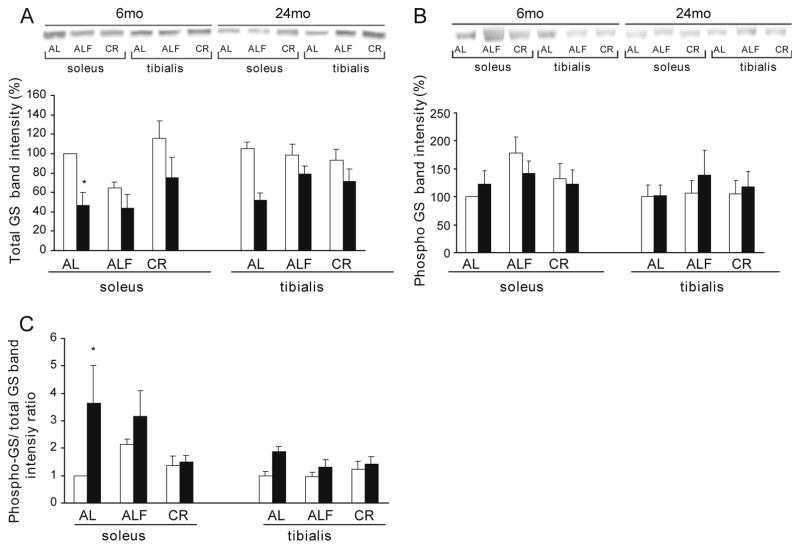
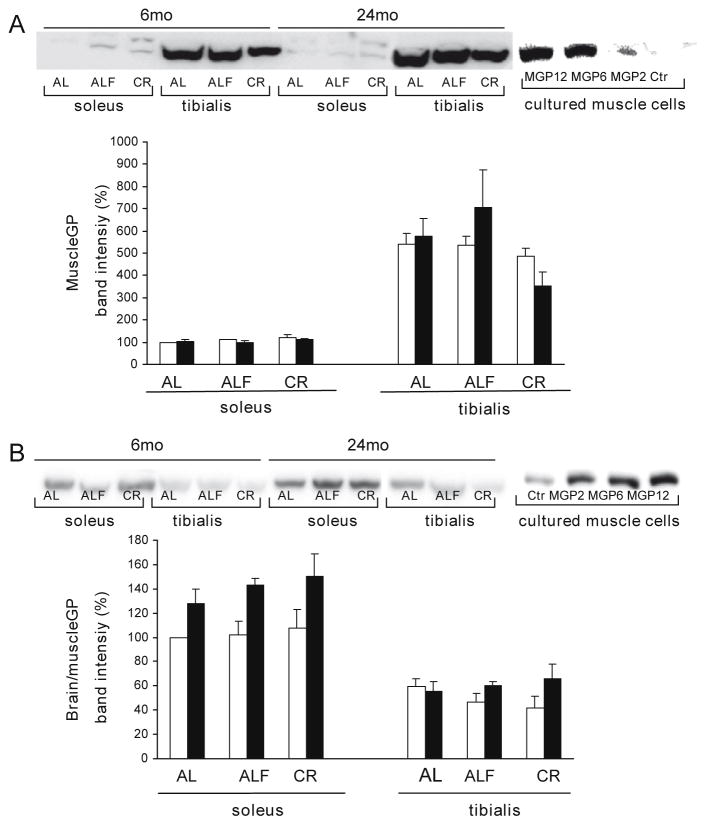
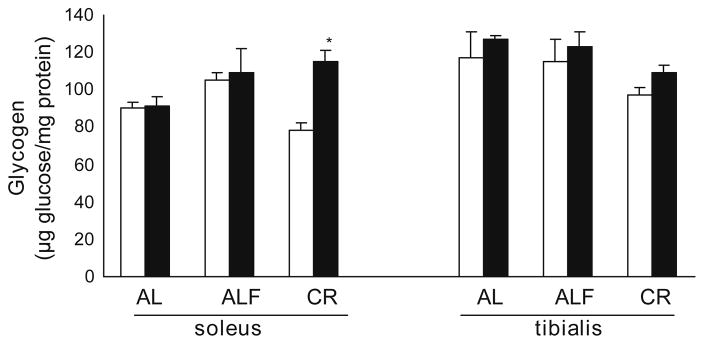
Calorie restriction's (CR) effects on age-associated changes in glycogen-metabolizing enzymes were studied in rat soleus (SOL) and tibialis anterior (TA) muscles. Old (24 months) compared to young (6 months) rats maintained ad libitum on a standard diet had reduced glycogen synthase (GS) activity, lower muscle GS protein levels, increased phosphorylation of GS at site 3a with less activation in SOL. Age-associated impairments in GS protein and activation-phosphorylation were also shown in TA. There was an age-associated reduction in glycogen phosphorylase (GP) activity level in SOL, while brain/muscle isoforms (B/M) of GP protein levels were higher. GP activity and protein levels were preserved, but GP was inactivated in TA with age. Glycogen content was unchanged in both muscles. CR did not alter GS or GP activity/protein levels in young rats. CR hindered age-related decreases in GS activity/protein, unrelated to GS mRNA levels, and GS inactivation-phosphorylation; not on GP. In older rats, CR enhanced glycogen accumulation in SOL. Short-term fasting did not recapitulate CR effects in old rats. Thus, the predominant age-associated impairments on skeletal muscle GS and GP activities occur in the oxidative SOL muscle of rats, and CR can attenuate the loss of GS activity/activation and stimulate glycogen accumulation.


Figures

Fig. 1
Fig. 1
Activity of glycogen-metabolizing enzymes. Rats were maintained from weaning to 6-months (h) or 24-months (j) on a standard, ad libitum (AL) or calorie restricted (CR) diet. AL rats were sacrificed in either a fed state (AL) or after an 18 h fasting period (ALF). All CR rats were sacrificed in the fed state. Enzyme activities were assessed in extracts from SOL and TA muscles: (A and B) GS activity measured (A) with or (B) without glucose 6-P and (C and D) GP activity measured (C) with or (D) without AMP. Means ± SEM from at least 5 rats in each group are shown. Age influenced: total GS activity (F 29.1, p < 0.0001), active GS activity (F 38.6, p < 0.0001), total GP activity (F 25.0, p < 0.0001) and active GP activity (F 17.2, p < 0.001) in SOL. Diet influenced: total GS activity (F 4.52, p < 0.05) and active GS (F 6.10, p < 0.01) in SOL. The significance of the differences is versus 6-month rats comparing equivalent diet and muscle *p < 0.05, **p < 0.01 and ***p < 0.001. The significance of the Student’s t-test for total and active GP activity in TA versus SOL muscle is p < 0.0001.
Fig. 2
Fig. 2
Immunoblot analysis of GS protein content. Western blot analyses were performed on total extracts (20 μg protein) from SOL and TA muscle samples and membranes hybridized with antibodies against (A) GS, (B) phospho-GS (Ser641/0). (C) phospho-GS/GS ratio was calculated. For each age group, muscle and dietary treatment a representative image is shown and bands were quantified with a LAS-3000 (FujiFilm). Means ± SEM from at least 5 rats for each group are shown. Data were compared using percentages with the mean value of the young AL group in the SOL Age influenced: total GS in SOL (F 15.8, p < 0.001) and in TA (F 11.3, p < 0.005); phospho-GS/GS ratio (F 5.16, p < 0.05) in SOL and in TA (F 6.63, p < 0.05). Diet influenced: total GS (F 5.36, p < 0.05) in SOL The significance of the differences is versus young rats comparing equivalent diet and muscle *p < 0.05.
Fig. 3
Fig. 3
Immunoblot analysis of muscle and brain/muscle GP protein content. Western blot analyses were performed on total extracts from SOL and TA muscle samples (20 μg of protein) and on extracts from cultured human muscles cells transfected with an adenovirus encoding GFP (Ctr) or an adenovirus encoding rabbit muscle GP cDNA (MGP) at increasing multiplicity of infection (10×) (20 μg (A) or 5 μg (B) of protein). Membranes hybridized with antibodies against (A) muscle GP, (B) brain/muscle GP. For each age group, muscle and dietary treatment a representative image is shown and bands were quantified with a LAS-3000 (FujiFilm). Means ± SEM from at least 5 rats for each group are shown. Data were compared using percentages with the mean value of the young AL group in the SOL Age influenced the brain/muscle GP protein in SOL (F 14.8, p < 0.001). The significance of Student’s t-test for muscle and brain/muscle GP protein in TA versus SOL muscle is p < 0.0001.
Fig. 4
Fig. 4
Glycogen content. Glycogen content was measured in extracts from SOL and TA muscles. Means ± SEM from at least 5 rats for each group are shown. There was an influence of diet (F 4.0, p < 0.05). The interaction of diet and age was also significative (F 4.4, p < 0.05) in SOL The significance of differences is versus young rats comparing equivalent diet and muscle *p < 0.05.

Similar articles

Cited by

References

    1. Baqué S, Guinovart JJ, Gómez-Foix AM. Overexpression of muscle glycogen phosphorylase in cultured human muscle fibers causes increased glucose consumption and nonoxidative disposal. J Biol Chem. 1996;271:2594–2598. - PubMed
    1. Buchbinder JL, Rath VL, Fletterick RJ. Structural relationships among regulated and unregulated phosphorylases. Annu Rev Biophys Biomol Struct. 2001;30:191–209. - PubMed
    1. Crerar MM, Karlsson O, Fletterick RJ, Hwang PK. Chimeric muscle and brain glycogen phosphorylases define protein domains governing isozyme- specific responses to allosteric activation. J Biol Chem. 1995;270:13748–13756. - PubMed
    1. Crosson SM, Khan A, Printen J, Pessin JE, Saltiel AR. PTG gene deletion causes impaired glycogen synthesis and developmental insulin resistance. J Clin Invest. 2003;111:1423–1432. - PMC - PubMed
    1. Dall’Aglio E, Chang H, Reaven GM, Azhar S. Age-related changes in rat muscle glycogen synthase activity. J Gerontol. 1987;42:168–172. - PMC - PubMed

Publication types