Overexpression of catalase delays G0/G1- to S-phase transition during cell cycle progression in mouse aortic endothelial cells
- PMID: 19341793
- PMCID: PMC2713001
- DOI: 10.1016/j.freeradbiomed.2009.03.018
Overexpression of catalase delays G0/G1- to S-phase transition during cell cycle progression in mouse aortic endothelial cells
Abstract
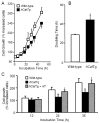
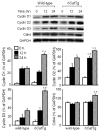
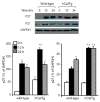
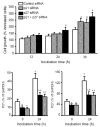
Although it is understood that hydrogen peroxide (H(2)O(2)) promotes cellular proliferation, little is known about its role in endothelial cell cycle progression. To assess the regulatory role of endogenously produced H(2)O(2) in cell cycle progression, we studied the cell cycle progression in mouse aortic endothelial cells (MAECs) obtained from mice overexpressing a human catalase transgene (hCatTg), which destroys H(2)O(2). The hCatTg MAECs displayed a prolonged doubling time compared to wild-type controls (44.0 +/- 4.7 h versus 28.6 +/- 0.8 h, p<0.05), consistent with a diminished growth rate and H(2)O(2) release. Incubation with aminotriazole, a catalase inhibitor, prevented the observed diminished growth rate in hCatTg MAECs. Inhibition of catalase activity with aminotriazole abrogated catalase overexpression-induced antiproliferative action. Flow cytometry analysis indicated that the prolonged doubling time was principally due to an extended G(0)/G(1) phase in hCatTg MAECs compared to the wild-type cells (25.0 +/- 0.9 h versus 15.9 +/- 1.4 h, p< 0.05). The hCatTg MAECs also exhibited decreased activities of the cyclin-dependent kinase (Cdk) complexes responsible for G(0)/G(1)- to S-phase transition in the cell cycle, including the cyclin D-Cdk4 and cyclin E-Cdk2 complexes. Moreover, the reduction in cyclin-Cdk activities in hCatTg MAECs was accompanied by increased protein levels of two Cdk inhibitors, p21 and p27, which inhibit the Cdk activity required for the G(0)/G(1)- to S-phase transition. Knockdown of p21 and/or p27 attenuated the antiproliferative effect of catalase overexpression in MAECs. These results, together with the fact that catalase is an H(2)O(2) scavenger, suggest that endogenously produced H(2)O(2) mediates MAEC proliferation by fostering the transition from G(0)/G(1) to S phase.
Conflict of interest statement
Figures


Similar articles
-
[G1 block of the cell cycle during differentiation of F9 cells correlates with accumulation of inhibitors of the activity of cyclin-kinase complexes of proteins p21/Waf1 and p27/Kip].Tsitologiia. 2002;44(7):649-55. Tsitologiia. 2002. PMID: 12455373 Russian.
-
Superoxide dismutase and catalase inhibit oxidized low-density lipoprotein-induced human aortic smooth muscle cell proliferation: role of cell-cycle regulation, mitogen-activated protein kinases, and transcription factors.Atherosclerosis. 2007 Jan;190(1):124-34. doi: 10.1016/j.atherosclerosis.2006.02.044. Epub 2006 Apr 5. Atherosclerosis. 2007. PMID: 16600249
-
Estrogen-induced activation of Cdk4 and Cdk2 during G1-S phase progression is accompanied by increased cyclin D1 expression and decreased cyclin-dependent kinase inhibitor association with cyclin E-Cdk2.J Biol Chem. 1997 Apr 18;272(16):10882-94. doi: 10.1074/jbc.272.16.10882. J Biol Chem. 1997. PMID: 9099745
-
Inhibition of the melanoma cell cycle and regulation at the G1/S transition by 12-O-tetradecanoylphorbol-13-acetate (TPA) by modulation of CDK2 activity.Exp Cell Res. 1995 Nov;221(1):92-102. doi: 10.1006/excr.1995.1356. Exp Cell Res. 1995. PMID: 7589260
-
Cyclins and CDKS in development and cancer: lessons from genetically modified mice.Front Biosci. 2006 Jan 1;11:1164-88. doi: 10.2741/1871. Front Biosci. 2006. PMID: 16146805 Review.
Cited by
-
Effects of survivin on angiogenesis in vivo and in vitro.Am J Transl Res. 2016 Feb 15;8(2):270-83. eCollection 2016. Am J Transl Res. 2016. PMID: 27158325 Free PMC article.
-
Interleukin-4 and interleukin-13 increase NADPH oxidase 1-related proliferation of human colon cancer cells.Oncotarget. 2017 Jun 13;8(24):38113-38135. doi: 10.18632/oncotarget.17494. Oncotarget. 2017. PMID: 28498822 Free PMC article.
-
Ability of recombinant human catalase to suppress inflammation of the murine lung induced by influenza A.Inflammation. 2014 Jun;37(3):809-17. doi: 10.1007/s10753-013-9800-2. Inflammation. 2014. PMID: 24385240 Free PMC article.
-
Overexpression of Cu/Zn-superoxide dismutase and/or catalase accelerates benzo(a)pyrene detoxification by upregulation of the aryl hydrocarbon receptor in mouse endothelial cells.Free Radic Biol Med. 2009 Oct 15;47(8):1221-9. doi: 10.1016/j.freeradbiomed.2009.08.001. Epub 2009 Aug 7. Free Radic Biol Med. 2009. PMID: 19666105 Free PMC article.
-
Fighting Hypoxia to Improve PDT.Pharmaceuticals (Basel). 2019 Oct 30;12(4):163. doi: 10.3390/ph12040163. Pharmaceuticals (Basel). 2019. PMID: 31671658 Free PMC article. Review.
References
-
- Sueishi K, Yonemitsu Y, Nakagawa K, Kaneda Y, Kumamoto M, Nakashima Y. Atherosclerosis and angiogenesis. Its pathophysiological significance in humans as well as in an animal model induced by the gene transfer of vascular endothelial growth factor. Ann N Y Acad Sci. 1997;811:311–322. - PubMed
-
- Spyridopoulos I, Andres V. Control of vascular smooth muscle and endothelial cell proliferaiton and its implicaiton in cardiovascular disease. Front Biosci. 1998;3:269–287. - PubMed
-
- Yasuda M, Ohzeki Y, Shimizu S, Naito S, Ohtsuru A, Yamamoto T, Kuroiwa Y. Stimulation of in vitro angiogenesis by hydrogen peroxide and the relation with Ets-1 in endothelial cells. Life Sci. 1998;64:249–258. - PubMed
-
- Ruiz-Gines JA, Lopez-Ongil S, Gonzalez-Rubio M, Gonzalez-Santiago L, Rodriguez-Puyol M, Rodriguez-Puyol D. Reactive oxygen species induce proliferation of bovine aortic endothelial cells. J Cardiovasc Pharmacol. 2000;35:109–113. - PubMed
Publication types
MeSH terms
Substances
Grants and funding
- K01HL-076623/HL/NHLBI NIH HHS/United States
- T32HL07735/HL/NHLBI NIH HHS/United States
- U54 CA091408/CA/NCI NIH HHS/United States
- F31 HL083921/HL/NHLBI NIH HHS/United States
- G12RR03032/RR/NCRR NIH HHS/United States
- F31HL083921/HL/NHLBI NIH HHS/United States
- T32 HL007735/HL/NHLBI NIH HHS/United States
- 5U54CA091408-07/CA/NCI NIH HHS/United States
- G12 RR003032/RR/NCRR NIH HHS/United States
- R01 ES014472/ES/NIEHS NIH HHS/United States
- R01ES014471/ES/NIEHS NIH HHS/United States
- K01 HL076623/HL/NHLBI NIH HHS/United States
- G12RR003032/RR/NCRR NIH HHS/United States
LinkOut - more resources
Full Text Sources
Molecular Biology Databases

