Magnetic resonance spectroscopy outcomes from a comprehensive magnetic resonance study of children with fetal alcohol spectrum disorders
- PMID: 19342189
- PMCID: PMC4230827
- DOI: 10.1016/j.mri.2009.01.003
Magnetic resonance spectroscopy outcomes from a comprehensive magnetic resonance study of children with fetal alcohol spectrum disorders
Abstract
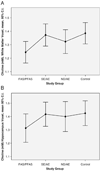
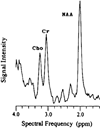
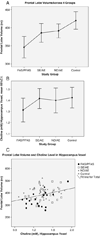
Magnetic resonance (MR) technology offers noninvasive methods for in vivo assessment of neuroabnormalities. A comprehensive neuropsychological/behavioral, MR imaging (MRI), MR spectroscopy (MRS) and functional MRI (fMRI) assessment was administered to children with fetal alcohol spectrum disorders (FASD) to determine whether global and/or focal abnormalities could be identified and to distinguish diagnostic subclassifications across the spectrum. The four study groups included (1) FAS/partial FAS; (2) static encephalopathy/alcohol exposed (SE/AE); (3) neurobehavioral disorder/alcohol exposed (ND/AE) as diagnosed with the FASD 4-Digit Code; and (4) healthy peers with no prenatal alcohol exposure. Results are presented in four separate reports: MRS (reported here) and neuropsychological/behavioral, MRI and fMRI outcomes (reported separately). MRS was used to compare neurometabolite concentrations [choline (Cho), n-acetyl-aspartate (NAA) and creatine (Cre)] in a white matter region and a hippocampal region between the four study groups. Choline concentration in the frontal/parietal white matter region, lateral to the midsection of the corpus callosum, was significantly lower in FAS/PFAS relative to all other study groups. Choline decreased significantly with decreasing frontal white matter volume and corpus callosum length. These outcomes suggest low choline concentrations may reflect white matter deficits among FAS/PFAS. Choline also decreased significantly with increasing severity of the 4-Digit FAS facial phenotype, increasing impairment in psychological performance and increasing alcohol exposure. NAA and Cre concentrations did not vary significantly. This study provides further evidence of the vulnerability of the cholinergic system in FASD.
Figures


Similar articles
-
Neuroimaging and fetal alcohol spectrum disorders.Dev Disabil Res Rev. 2009;15(3):209-17. doi: 10.1002/ddrr.72. Dev Disabil Res Rev. 2009. PMID: 19731391 Free PMC article. Review.
-
Magnetic resonance imaging outcomes from a comprehensive magnetic resonance study of children with fetal alcohol spectrum disorders.Alcohol Clin Exp Res. 2009 Oct;33(10):1671-89. doi: 10.1111/j.1530-0277.2009.01004.x. Epub 2009 Jul 1. Alcohol Clin Exp Res. 2009. PMID: 19572986 Free PMC article.
-
Neuropyschological and behavioral outcomes from a comprehensive magnetic resonance study of children with fetal alcohol spectrum disorders.Can J Clin Pharmacol. 2009 Winter;16(1):e178-201. Epub 2009 Mar 27. Can J Clin Pharmacol. 2009. PMID: 19329824 Free PMC article. Clinical Trial.
-
Brain metabolic alterations in adolescents and young adults with fetal alcohol spectrum disorders.Alcohol Clin Exp Res. 2006 Dec;30(12):2097-104. doi: 10.1111/j.1530-0277.2006.00257.x. Alcohol Clin Exp Res. 2006. PMID: 17117975
-
Neuroimaging effects of prenatal alcohol exposure on the developing human brain: a magnetic resonance imaging review.Acta Neuropsychiatr. 2015 Oct;27(5):251-69. doi: 10.1017/neu.2015.12. Epub 2015 Mar 17. Acta Neuropsychiatr. 2015. PMID: 25780875 Review.
Cited by
-
Neuroimaging and fetal alcohol spectrum disorders.Dev Disabil Res Rev. 2009;15(3):209-17. doi: 10.1002/ddrr.72. Dev Disabil Res Rev. 2009. PMID: 19731391 Free PMC article. Review.
-
Regional brain volume reductions relate to facial dysmorphology and neurocognitive function in fetal alcohol spectrum disorders.Hum Brain Mapp. 2012 Apr;33(4):920-37. doi: 10.1002/hbm.21260. Epub 2011 Mar 17. Hum Brain Mapp. 2012. PMID: 21416562 Free PMC article.
-
Age differences in high frequency phasic heart rate variability and performance response to increased executive function load in three executive function tasks.Front Psychol. 2015 Mar 5;5:1470. doi: 10.3389/fpsyg.2014.01470. eCollection 2014. Front Psychol. 2015. PMID: 25798113 Free PMC article.
-
Examination of cortically projecting cholinergic neurons following exercise and environmental intervention in a rodent model of fetal alcohol spectrum disorders.Birth Defects Res. 2021 Feb 1;113(3):299-313. doi: 10.1002/bdr2.1839. Epub 2020 Nov 10. Birth Defects Res. 2021. PMID: 33174398 Free PMC article.
-
An in vivo 1H magnetic resonance spectroscopy study of the deep cerebellar nuclei in children with fetal alcohol spectrum disorders.Alcohol Clin Exp Res. 2014 May;38(5):1330-8. doi: 10.1111/acer.12380. Epub 2014 Mar 21. Alcohol Clin Exp Res. 2014. PMID: 24655149 Free PMC article.
References
-
- Smith DW. The fetal alcohol syndrome. Hosp Pract. 1979;14(10):121–128. - PubMed
-
- Astley SJ, Clarren SK. Measuring the facial phenotype of individuals with prenatal alcohol exposure: correlations with brain dysfunction. Alcohol Alcohol. 2001;36:147–159. - PubMed
-
- Astley S, Stachowiak J, Clarren S, Clausen C. Application of the fetal alcohol syndrome facial photographic screening tool in a foster care population. J Pediatr. 2002;141(5):712–717. - PubMed
-
- Aase JM, Jones KL, Clarren SK. Do we need the term “FAE”? Pediatrics. 1995;95:428–430. - PubMed
-
- Streissguth AP, Bookstein FL, Sampson PC, Barr HM. Ann Arbor (Mich) University of Michigan Press; 1993. The enduring effects of prenatal alcohol exposure on child development: Birth through seven years a partial least squares solution.
Publication types
MeSH terms
Substances
Grants and funding
LinkOut - more resources
Full Text Sources
Medical
Research Materials
Miscellaneous

