. 2009 May;174(5):1940-8.
doi: 10.2353/ajpath.2009.080718. Epub 2009 Mar 26.

MicroRNA-196a is a potential marker of progression during Barrett's metaplasia-dysplasia-invasive adenocarcinoma sequence in esophagus

Affiliations

MicroRNA-196a is a potential marker of progression during Barrett's metaplasia-dysplasia-invasive adenocarcinoma sequence in esophagus

Dipen M Maru et al. Am J Pathol. 2009 May.

Abstract

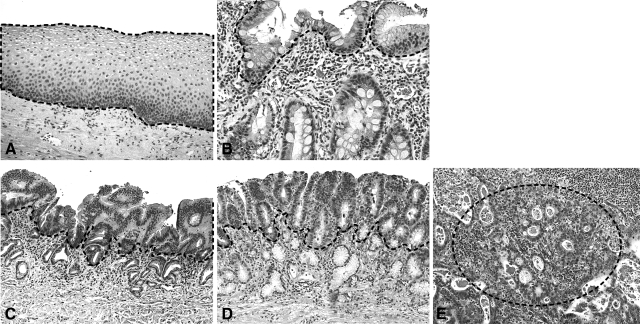
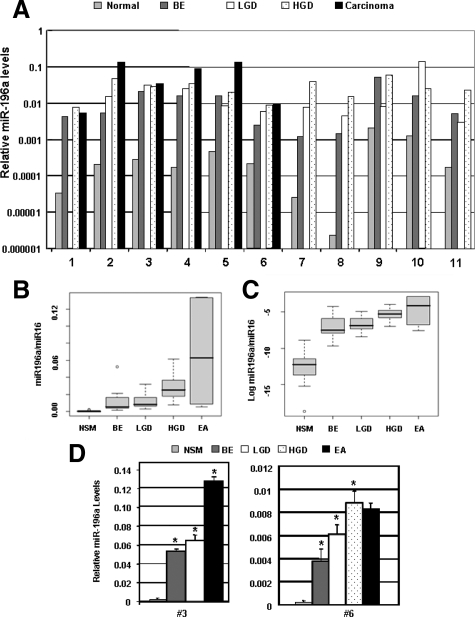
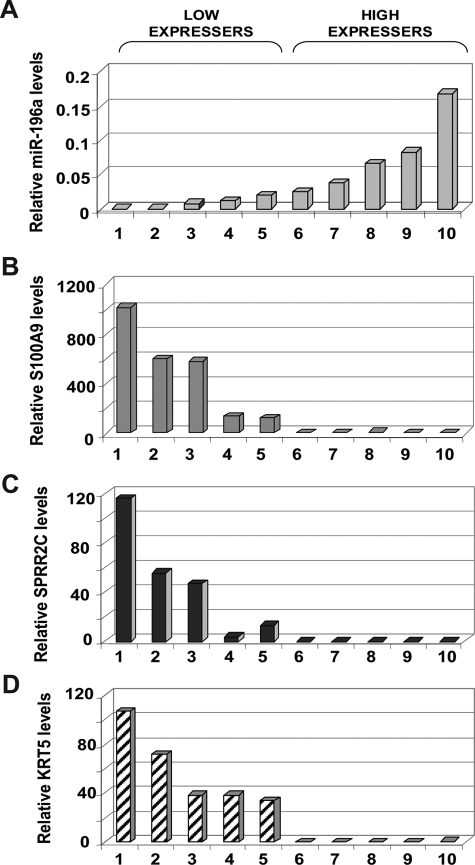
Barrett's esophagus (BE)/Barrett's metaplasia (BM) is a recognized precursor of esophageal adenocarcinoma (EA) with an intermediary stage of dysplasia. The low yield and high cost of endoscopic screening of patients with BE underscores the need for novel biomarkers, such as microRNA (miRNA), which have emerged as important players in neoplastic progression for risk assessment of developing dysplasia/adenocarcinoma. Recently, we reported highly elevated levels of miRNA-196a (miR-196a) in EA and demonstrated its growth-promoting and anti-apoptotic functions. Here, we evaluated miR-196a as a marker of BE progression to low-grade dysplasia, high-grade dysplasia, and EA using microdissected paraffin-embedded tissues from 11 patients. Higher levels of miR-196a were observed in EA, BE, and dysplastic lesions compared with normal squamous mucosa, and in high-grade dysplasia compared with BE and low-grade dysplasia. Using frozen tumor tissues from 10 additional patients who had advanced EA, we evaluated the correlation of miR-196a with its in silico-predicted targets, keratin 5 (KRT5), small proline-rich protein 2C (SPRR2C), and S100 calcium-binding protein A9 (S100A9), which are down-regulated during BE progression. MiR-196a levels inversely correlated with the predicted target mRNA levels in EA. We confirmed that miR-196a specifically targets KRT5, SPRR2C, and S100A9 3' UTRs using miR-196a-mimic and luciferase reporter-based assays. In conclusion, this study identified miR-196a as a potential marker of progression of BE and KRT5, SPRR2C, and S100A9 as its targets.


Figures

Figure 1
Figure 1
Morphology of the different progression stages of EA. H&E-stained sections showing stages of progression from normal squamous (A), BE (B), LGD (C), HGD (D) to invasive adenocarcinoma (E) from a representative case. The dotted line indicates areas used in manual microdissection. Original magnifications, ×200.
Figure 2
Figure 2
Predicted base complementarity of miR-196a to S100A9, SPRR2C, and KRT5. The base complementarity of miR-196a to 3′-UTR binding sites of S100A9, SPRR2C, and KRT5 as predicted by Sanger miR-database (http://microrna.sanger.ac.uk/sequences/).
Figure 3
Figure 3
Micro-RNA 196a levels are characteristically up-regulated with progression of EA. A: Real-time qRT PCR analysis of miR-196a levels in each lesion in each patient. Each bar represents average miRNA expression level of duplicate reactions of a single experiment. The figure shows an increase in the levels of miR-196a with neoplastic progression of normal esophageal mucosa (N) to adenocarcinoma (EA). The greatest increase in the levels of miR-196a was observed between N and BE with smaller increases in subsequent stages of neoplastic histological progression from BE to low-grade (LGD), LGD to high-grade dysplasia (HGD), and to EA. B: The box plots of the average levels of miR-196a at each stage of progression in the 11 patients. Each box shows the variation of relative values of miRs and the black horizontal bar shows the mean value in each box. C: Box plots of the log transformed relative values of miR-196a during progression. D: Analysis of miR-196a levels from multiple separately microdissected samples with same histology in two patients. RNA was isolated from two to three different areas of same histological stage of progression, ie, BE, LGD, HGD, and EA and miR-196a levels were measured by qRT-PCR separately from each site in duplicates. Each bar represents mean miR-196a level (±SD) from multiple sites within same histology from a single experiment. As illustrated in the figure, there was minimal variation in the levels of miRNA among multiple sites of same histology. Asterisks indicate miRNA levels were significantly higher in BE compared with NSM, LGD compared with BE, and in HGD/EA compared with LGD (P < 0.05).
Figure 4
Figure 4
Inverse correlation of miR-196a levels with mRNA levels of S100A2, SPRR2C, and KRT5, three genes characteristically down-regulated in EA. A: Relative miR-196a levels in advanced EAs from 10 patients as measured by real-time qPCR. The relative levels showed considerable variation among EA, so the EA specimens were arbitrarily grouped into low- (samples 1 to 5) and high-expressing (6 to 10) tumors. The relative mRNA levels of S100A2 (B), SPRR2C (C), and KRT5 (D) in the same samples were inversely correlated with the relative levels of miR-196a. Each data point represents mean expression levels of duplicates from a single experiment.
Figure 5
Figure 5
Elevation of miR-196a levels in EA cells suppresses expression of S100A9, SPRR2C, and KRT5. Elevating the levels of miR-196a by transfection of RNA mimics in the EA cell line BIC1 resulted in suppression of the mRNA levels of all three genes, as measured by real-time qPCR assay. The relative mRNA levels of these genes in BIC1 cells transfected with a nonspecific miRNA mimic was considered as the respective control. Each data point represents average expression levels of duplicates from a single experiment.
Figure 6
Figure 6
SPRR2C, S100A9, and KRT5 mRNAs are direct targets of miR-196a. A: The schematic depiction of luciferase assay. To demonstrate the direct targeting of these mRNA by miR-196a, the 3′-UTRs of the genes with the predicted miR-196a binding sites were cloned upstream of the luciferase gene in PGL3 vector plasmid. When transfected into cells the mRNA transcript of the luciferase generated from the vector plasmid has the 3′-UTR of the gene of interest, and the additional miR-196a generated from the RNA mimics binds to the luciferase mRNA and suppresses its levels, resulting in a decrease in luciferase activity. B: The plasmid and RNA mimics of miR-196a were co-transfected into BIC1 and OE33 cells and the effect of miR-196a on luciferase gene transcription was measured by luciferase assay. The figure shows mean ± SD of triplicates from a single experiment. Repression of luciferase activity demonstrated the direct binding and repressive effect of miR-196a on the mRNA of these three genes. A nonspecific miRNA mimic co-transfected with the luciferase plasmid was used as the respective control. The decrease in the luciferase activity was statistically significant for all targets (P < 0.05). The luciferase assay for all three genes was repeated twice in both cell lines and a representative result is shown here.

References

    1. Devesa SS, Blot WJ, Fraumeni JF., Jr Changing patterns in the incidence of esophageal and gastric carcinoma in the United States. Cancer. 1998;83:2049–2053. - PubMed
    1. Shaheen NJ, Crosby MA, Bozymski EM, Sandler RS. Is there publication bias in the reporting of cancer risk in Barrett’s esophagus? Gastroenterology. 2000;119:333–338. - PubMed
    1. Swisher SG, Hunt KK, Holmes EC, Zinner MJ, McFadden DW. Changes in the surgical management of esophageal cancer from 1970 to 1993. Am J Surg. 1995;169:609–614. - PubMed
    1. Reid BJ, Prevo LJ, Galipeau PC, Sanchez CA, Longton G, Levine DS, Blount PL, Rabinovitch PS. Predictors of progression in Barrett’s esophagus II: baseline 17p (p53) loss of heterozygosity identifies a patient subset at increased risk for neoplastic progression. Am J Gastroenterol. 2001;96:2839–2848. - PMC - PubMed
    1. Reid BJ, Blount PL, Rabinovitch PS. Biomarkers in Barrett’s esophagus. Gastrointest Endosc Clin N Am. 2003;13:369–397. - PubMed

Publication types

MeSH terms