. 2009 Jul;150(7):3083-91.
doi: 10.1210/en.2008-1706. Epub 2009 Apr 2.

Pegylated leptin antagonist is a potent orexigenic agent: preparation and mechanism of activity

Affiliations

Pegylated leptin antagonist is a potent orexigenic agent: preparation and mechanism of activity

Eran Elinav et al. Endocrinology. 2009 Jul.

Abstract

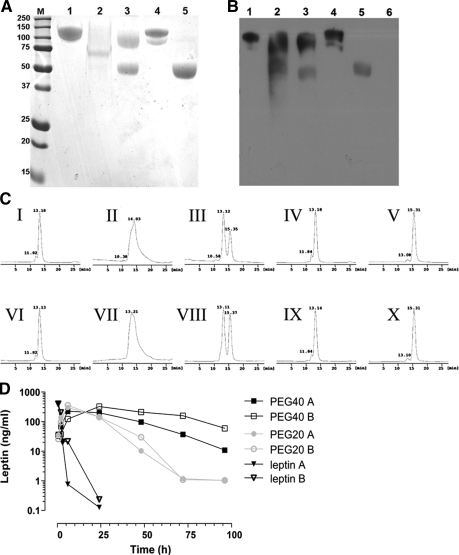
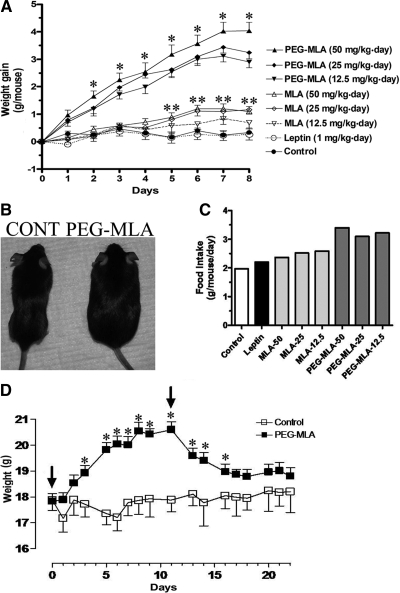
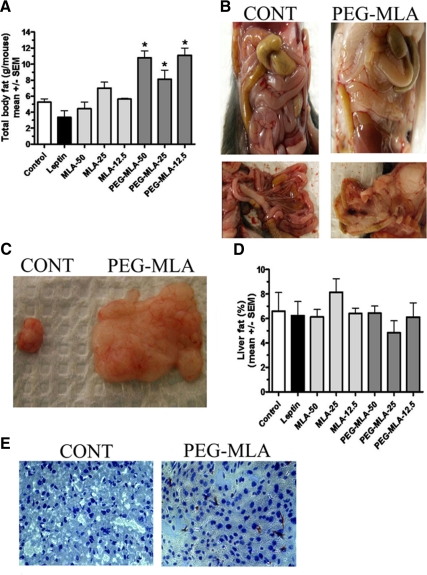
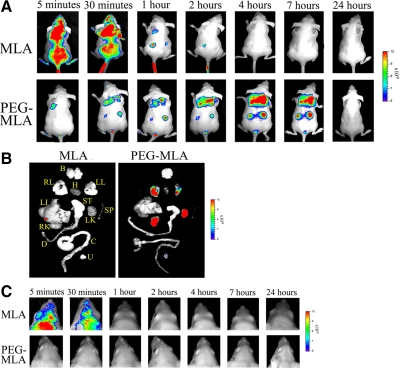
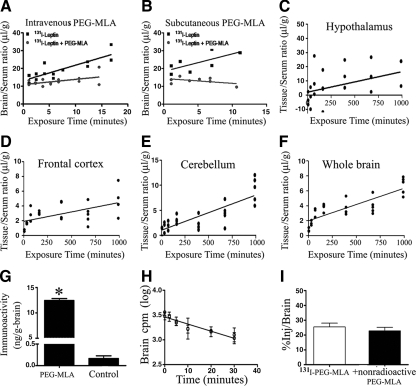
Leptin, a pleiotropic adipokine, is a central regulator of appetite and weight and a key immunomodulatory protein. Although inborn leptin deficiency causes weight gain, it is unclear whether induced leptin deficiency in adult wild-type animals would be orexigenic. Previous work with a potent competitive leptin antagonist did not induce a true metabolic state of leptin deficiency in mice because of a short circulating half-life. In this study, we increased the half-life of the leptin antagonist by pegylation, which resulted in significantly increased bioavailability and retaining of antagonistic activity. Mice administered the pegylated antagonist showed a rapid and dramatic increase in food intake with weight gain. Resulting fat was confined to the mesenteric region with no accumulation in the liver. Serum cholesterol, triglyceride, and hepatic aminotransferases remained unaffected. Weight changes were reversible on cessation of leptin antagonist treatment. The mechanism of severe central leptin deficiency was found to be primarily caused by blockade of transport of circulating leptin across the blood-brain barrier with antagonisms at the arcuate nucleus playing a more minor role. Altogether we introduce a novel compound that induces central and peripheral leptin deficiency. This compound should be useful in exploring the involvement of leptin in metabolic and immune processes and could serve as a therapeutic for the treatment of cachexia.


Figures

Figure 1
Figure 1
Chemical characterization of pegylated leptins and leptin antagonists. A, SDS-PAGE analysis of pegylated proteins stained with Coomassie Blue. B, Western blotting of pegylated leptins with AGP3 monoclonal antibody directed against PEG. Lanes: M, Molecular weight marker proteins; 1, branched mPEG2-NHS 40 kDa; 2, mPEG-SMB 30 kDa; 3, mPEG-SMB 20 kDa; 4, branched mPEG2-butyr-ALD 40 kDa; 5, mPEG-butyr-ALD 20 kDa; 6, non-pegylated human leptin (only in B). C, Purity determination of the pegylated leptins by gel-filtration analysis. Pegylated WT leptins (I–V) and pegylated leptin antagonists (VI–X). I and VI, branched mPEG2-NHS 40 kDa; II and VII, mPEG-SMB 30 kDa; III and VIII,- mPEG-SMB 20 kDa; IV and IX, branched mPEG2-butyr-ALD 40 kDa; V and X, mPEG-butyr-ALD 20 kDa. The column was calibrated with leptin (16 kDa), chicken leptin binding domain (chLBD, 24.5 kDa) leptin-chLBD complex (40.5 kDa), BSA (66 kDa), bovine IgG monomer (150 kDa), and dimer (300 kDa). D, Serum levels of recombinant human nonpegylated leptin (open and filled triangles), human leptin pegylated with mPEG2-NHS 40 kDa (open and filled squares) or with mPEG-butyr-ALD 20 kDa (open and filled circles) after a single sc injection of 20 μg protein/mouse. Serum levels of the proteins were measured by ELISA. Data are means of duplicate wells for two mice (A and B), and the experiment was repeated twice.
Figure 2
Figure 2
Induction of leptin deficiency by pegylated leptin antagonist. A, WT C57Bl mice (n = 4) were administered sc at the specified doses of PEG-MLA or leptin, and weight was recorded daily for a total of 8 d. Mice administered with all three doses of PEG-MLA featured a significantly increased weight gain as compared with either MLA or controls (*, P < 0.05). Only mice administered 25 and 50 mg/kg · d MLA doses for more than 5 d developed significantly increased weight gain as compared to controls (**, P < 0.05). B, Appearance of representative control (CONT) and PEG-MLA-administered mice. C, Average daily food intake of mice administered specified doses of PEG-MLA or leptin during the 8-d period. D, For determination of the reversibility of leptin deficiency, WT C57Bl mice (n = 6) were administered sc with 25 mg/kg · d PEG-MLA or vehicle for 11 d, followed by cessation of treatment (start and finish days of treatment are marked by arrows). PEG-MLA-treated mice featured a significantly increased weight gain as compared with controls (*, P < 0.05). Cessation of treatment was associated with return to baseline weight levels within a 1-wk period.
Figure 3
Figure 3
Pegylated leptin antagonist-induced fat accumulation. A, WT C57Bl mice (n = 7) were administered sc at the specified doses of PEG-MLA or leptin, killed after 8 d, and total body fat content and hepatic fat content were measured using choloroform:methanol dissolution. PEG-MLA-administered mice featured a significantly increased total body fat content (*, P < 0.05). B, Mesenteric fat distribution from representative control and PEG-MLA-administered mice. C, Total amount of mesenteric fat dissected from representative control and PEG-MLA-administered mice. D, Hepatic fat content in mice was measured as described above. No significant differences were noted between PEG-MLA and leptin-administered or control mice (P = NS). E, Representative Oil-red-O sections from livers of representative control and PEG-MLA-administered mice. No significant fat deposition was noted in any of the mouse groups.
Figure 4
Figure 4
In vivo distribution of pegylated leptin antagonist. A, In vivo imaging of WT mice receiving 600 μg iv Alexa Fluor 680-labeled MLA or PEG-MLA (n = 2). Mice were subjected to whole-body imaging (IVIS 100 Series Imaging System) at the indicated intervals. A single representative mouse is shown at all time points. Two independent experiments were performed, with similar results. B, In vivo imaging of explanted organs from mice in A, 24 h after injection. B, Brain; RL and LL, right and left lungs, respectively; H, heart; Li, liver; ST, stomach; SP, spleen; RK and LK, right and left kidney, respectively; D, duodenum; C, colon; U, urinary bladder. C, In vivo imaging indicating brain uptake of either MLA or PEG-MLA at the indicated time points.
Figure 5
Figure 5
Comparison of blood-to-brain transport and clearance of MLA and PEG-MLA. A, Multiple time-regression analysis of 131I-PEG-MLA after iv injection. The lack of a statistically significant correlation between brain-to-serum ratios and Expt (i.e. a flat line) indicates a lack of measurable transfer across the BBB during this time period. B, Multiple time-regression analysis of 131I-MLA after iv injection. A significant correlation between brain-to-serum ratios and Expt indicates measurable transfer across the BBB. The unidirectional blood-to-brain influx rate was measured to be 0.277 μl/g · min. C, Clearance from blood after iv injection of 131I-PEG-MLA. Inset, Data plotted in log-linear format. Calculated half-time disappearance from blood was 66.7 min (P < 0.0001, r = 0.73, n = 2–3 mice per time point). D, Clearance from blood after iv injection of 131I-MLA. Inset, Data plotted in log-linear format. Calculated half-time disappearance from blood was 18.0 min (P < 0.0001, r = 0.88, n = 2 mice per time point).
Figure 6
Figure 6
Effect of PEG-MLA on blood-brain leptin transport. PEG-MLA was given iv (A) or sc (B) to test its effect on the transport of iv-administered radioactive murine leptin across the BBB. PEG-MLA administration via both routes significantly inhibited leptin transport across the BBB. C–F, Uptake of iv-administered 131I-PEG-MLA into four representative brain regions over a 16-h time course. Brain-to-serum ratios were corrected for 125I-albumin ratios to compensate for leakage through extracellular pathways. Uptake was low but measurable, reaching a highest rate of Ki = 0.0144 in the hypothalamus. G, Brain PEG-MLA and leptin levels. Mean PEG-MLA levels in treated mice was 12.4 ± 0.42 ng/g brain, as compared to 0.17 ± 0.06 ng/g brain endogenous leptin in vehicle-treated mice (P < 0.05). H and I, Brain-to-blood 131I-PEG-MLA efflux. Slow rate of clearance from brain (H) and lack of inhibition of unlabeled PEG-MLA on 131I-PEG-MLA efflux in excess of non-labeled PEG-MLA (I), indicate that PEG-MLA is not effluxed from the brain by a saturable system.

References

    1. Zhang Y, Proenca R, Maffei M, Barone M, Leopold L, Friedman JM 1994 Positional cloning of the mouse obese gene and its human homologue. Nature 372:425–432 - PubMed
    1. Karmazyn M, Purdham DM, Rajapurohitam V, Zeidan A 2007 Leptin as a cardiac hypertrophic factor: a potential target for therapeutics. Trends Cardiovasc Med 17:206–211 - PubMed
    1. Peelman F, Waelput W, Iserentant H, Lavens D, Eyckerman S, Zabeau L, Tavernier J 2004 Leptin: linking adipocyte metabolism with cardiovascular and autoimmune diseases. Prog Lipid Res 43:283–301 - PubMed
    1. La Cava A, Matarese G 2004 The weight of leptin in immunity. Nat Rev Immunol 4:371–379 - PubMed
    1. Matarese G, Moschos S, Mantzoros CS 2005 Leptin in immunology. J Immunol 174:3137–3142 - PubMed

Publication types