

Meta-analysis of genome-wide scans for human adult stature identifies novel Loci and associations with measures of skeletal frame size
- PMID: 19343178
- PMCID: PMC2661236
- DOI: 10.1371/journal.pgen.1000445
Meta-analysis of genome-wide scans for human adult stature identifies novel Loci and associations with measures of skeletal frame size
Abstract
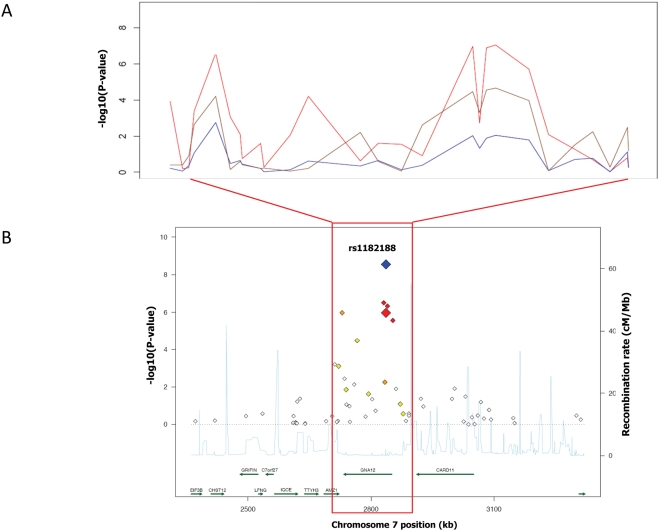
Recent genome-wide (GW) scans have identified several independent loci affecting human stature, but their contribution through the different skeletal components of height is still poorly understood. We carried out a genome-wide scan in 12,611 participants, followed by replication in an additional 7,187 individuals, and identified 17 genomic regions with GW-significant association with height. Of these, two are entirely novel (rs11809207 in CATSPER4, combined P-value = 6.1x10(-8) and rs910316 in TMED10, P-value = 1.4x10(-7)) and two had previously been described with weak statistical support (rs10472828 in NPR3, P-value = 3x10(-7) and rs849141 in JAZF1, P-value = 3.2x10(-11)). One locus (rs1182188 at GNA12) identifies the first height eQTL. We also assessed the contribution of height loci to the upper- (trunk) and lower-body (hip axis and femur) skeletal components of height. We find evidence for several loci associated with trunk length (including rs6570507 in GPR126, P-value = 4x10(-5) and rs6817306 in LCORL, P-value = 4x10(-4)), hip axis length (including rs6830062 at LCORL, P-value = 4.8x10(-4) and rs4911494 at UQCC, P-value = 1.9x10(-4)), and femur length (including rs710841 at PRKG2, P-value = 2.4x10(-5) and rs10946808 at HIST1H1D, P-value = 6.4x10(-6)). Finally, we used conditional analyses to explore a possible differential contribution of the height loci to these different skeletal size measurements. In addition to validating four novel loci controlling adult stature, our study represents the first effort to assess the contribution of genetic loci to three skeletal components of height. Further statistical tests in larger numbers of individuals will be required to verify if the height loci affect height preferentially through these subcomponents of height.
Conflict of interest statement
The authors have declared that no competing interests exist.
Figures
References
-
- Wadsworth ME, Hardy RJ, Paul AA, Marshall SF, Cole TJ. Leg and trunk length at 43 years in relation to childhood health, diet and family circumstances; evidence from the 1946 national birth cohort. Int J Epidemiol. 2002;31:383–390. - PubMed
-
- Garn SM, Silverman FN, Rohmann CG. A Rational Approach to the Assessment of Skeletal Maturation. Ann Radiol (Paris) 1964;10:297–307. - PubMed
-
- Borkan GA, Hults DE, Glynn RJ. Role of longitudinal change and secular trend in age differences in male body dimensions. Hum Biol. 1983;55:629–641. - PubMed
-
- Buschang PH, Malina RM, Little BB. Linear growth of Zapotec schoolchildren: growth status and yearly velocity for leg length and sitting height. Ann Hum Biol. 1986;13:225–234. - PubMed
-
- Tanner JM, Hayashi T, Preece MA, Cameron N. Increase in length of leg relative to trunk in Japanese children and adults from 1957 to 1977: comparison with British and with Japanese Americans. Ann Hum Biol. 1982;9:411–423. - PubMed
Publication types
MeSH terms
Grants and funding
LinkOut - more resources
Full Text Sources
Other Literature Sources
Molecular Biology Databases
Miscellaneous
