. 2009 Apr;5(4):e1000347.
doi: 10.1371/journal.pcbi.1000347. Epub 2009 Apr 3.

Maximal extraction of biological information from genetic interaction data

Affiliations

Maximal extraction of biological information from genetic interaction data

Gregory W Carter et al. PLoS Comput Biol. 2009 Apr.

Abstract

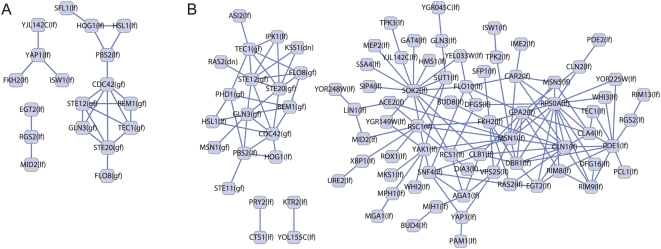
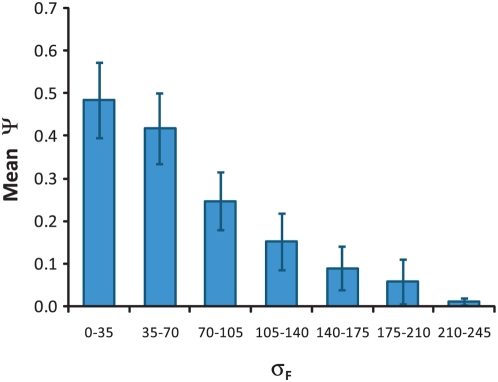
Extraction of all the biological information inherent in large-scale genetic interaction datasets remains a significant challenge for systems biology. The core problem is essentially that of classification of the relationships among phenotypes of mutant strains into biologically informative "rules" of gene interaction. Geneticists have determined such classifications based on insights from biological examples, but it is not clear that there is a systematic, unsupervised way to extract this information. In this paper we describe such a method that depends on maximizing a previously described context-dependent information measure to obtain maximally informative biological networks. We have successfully validated this method on two examples from yeast by demonstrating that more biological information is obtained when analysis is guided by this information measure. The context-dependent information measure is a function only of phenotype data and a set of interaction rules, involving no prior biological knowledge. Analysis of the resulting networks reveals that the most biologically informative networks are those with the greatest context-dependent information scores. We propose that these high-complexity networks reveal genetic architecture at a modular level, in contrast to classical genetic interaction rules that order genes in pathways. We suggest that our analysis represents a powerful, data-driven, and general approach to genetic interaction analysis, with particular potential in the study of mammalian systems in which interactions are complex and gene annotation data are sparse.


Conflict of interest statement

The authors have declared that no competing interests exist.

Figures

Figure 1
Figure 1. MMS-growth network with maximal set complexity, Ψ.
(A) is the complete network. Sub-networks of relationships shown in Table 2 for (B) Rule 1, (C) Rule 2, (D) Rule 3, (E) Rule 4, and (F) Rule 5. The same color codes are used in Figure 3.
Figure 2
Figure 2. Biological information as a function of set complexity Ψ in the MMS-growth networks.
Average number of biological statements (significance P<0.01) for binned complexity calculated from all possible networks. Error bars denote the standard deviation of binned data points.
Figure 3
Figure 3. Examples of biological information extracted from the maximally complex MMS-growth network.
(A) Deletion of PSY3 interacts via Rule 1 (red edges) with meiotic recombination gene deletions. (B) Deletion of SGS1 interacts via Rule 5 (green edges) with four error-free DNA repair gene deletions. Deletion of SWC5 interacts with the same genes via Rule 2 (orange edges). These four genes interact via Rule 4 (violet edges), significantly for CSM2 and SHU2 deletions. (C) Deletion of HPR5 interacts via Rule 3 (blue edges) with genes involved in negative regulation of DNA transposition and via Rule 1 (red edges) to genes involved in gene conversion at mating-type locus. Deletion of RTT101 interacts via Rule 2 (orange edges) with heteroduplex formation genes.
Figure 4
Figure 4. Networks of mutual information for yeast invasion data.
Nodes represent alleles and edges represent significant mutual information between the connected alleles. (A) Mutual information network obtained using the classification scheme of Drees, et al, showing all pairs of significance p<0.001 . (B) Mutual information network obtained using the maximally complex classification scheme on the same data, showing all pairs of significance p<0.0001. The maximally complex classification scheme produces more pairs and higher significance.
Figure 5
Figure 5. Network modularity of genetic interactions.
(A) A simple, hypothetical genetic interaction network of seven genes with three biological functions. (B) An example biological statement inferred from the genetic interaction network, establishing a coherent interaction rule between gene perturbation F and Function 1. (C) Inferred mutual information network that exhibits the functional modularity of the genetic network.
Figure 6
Figure 6. Set complexity Ψ as a function of the number of interaction rules in the MMS-growth networks.
Average complexity as a function of number of rules for all possible networks. Error bars denote the standard deviation of binned data points.
Figure 7
Figure 7. Set complexity Ψ as a function of the standard deviation of interaction rule frequencies in the MMS-growth networks.
Average complexity for binned standard deviations of rule frequencies calculated from all possible networks. Error bars denote the standard deviation of binned data points.

Similar articles

Cited by

References

    1. Ideker T, Galitski T, Hood L. A new approach to decoding life: systems biology. Annu Rev Genomics Hum Genet. 2001;2:343–372. - PubMed
    1. Tong AH, Lesage G, Bader GD, Ding H, Xu H, et al. Global mapping of the yeast genetic interaction network. Science. 2004;303:808–813. - PubMed
    1. Dudley AM, Janse DM, Tanay A, Shamir R, Church GM. A global view of pleiotropy and phenotypically derived gene function in yeast. Mol Syst Biol. 2005;1:2005 0001. - PMC - PubMed
    1. Schuldiner M, Collins SR, Thompson NJ, Denic V, Bhamidipati A, et al. Exploration of the function and organization of the yeast early secretory pathway through an epistatic miniarray profile. Cell. 2005;123:507–519. - PubMed
    1. Drees BL, Thorsson V, Carter GW, Rives AW, Raymond MZ, et al. Derivation of genetic interaction networks from quantitative phenotype data. Genome Biol. 2005;6:R38. - PMC - PubMed

Publication types

MeSH terms

LinkOut - more resources