

Probing the flexibility of large conformational changes in protein structures through local perturbations
- PMID: 19343225
- PMCID: PMC2660149
- DOI: 10.1371/journal.pcbi.1000343
Probing the flexibility of large conformational changes in protein structures through local perturbations
Abstract
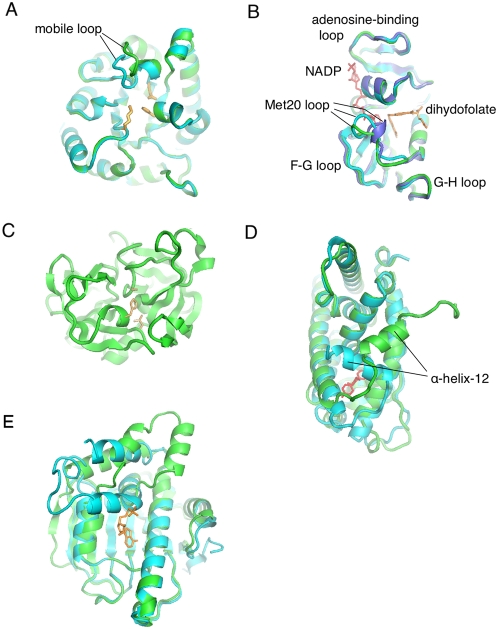
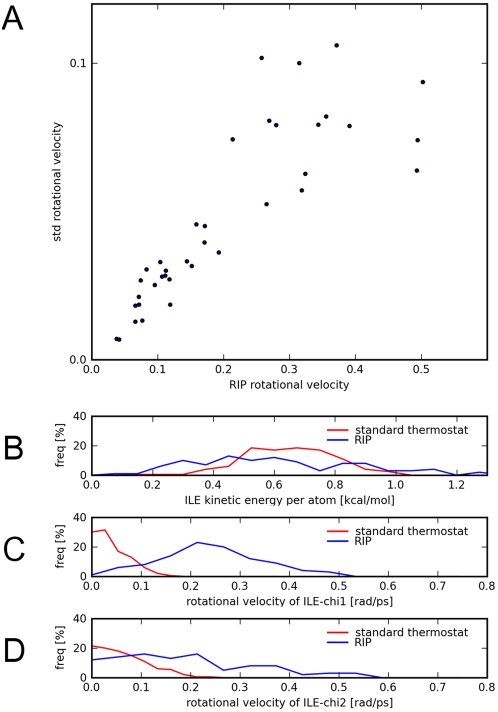
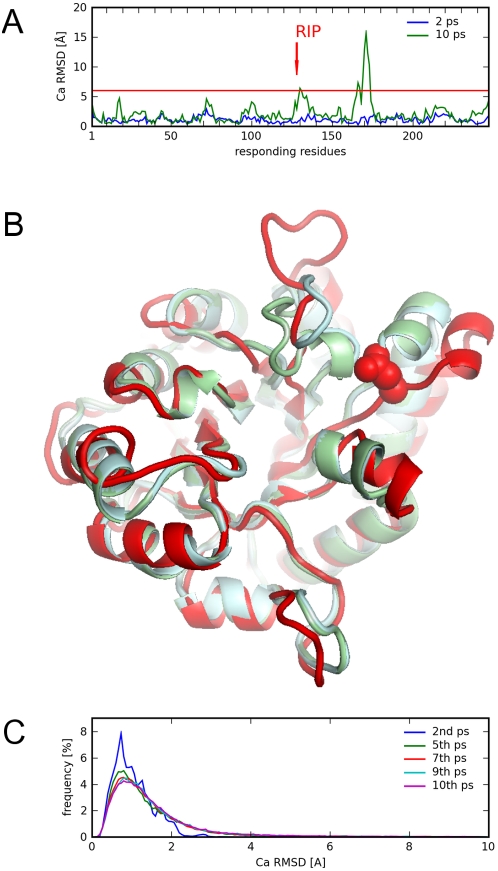
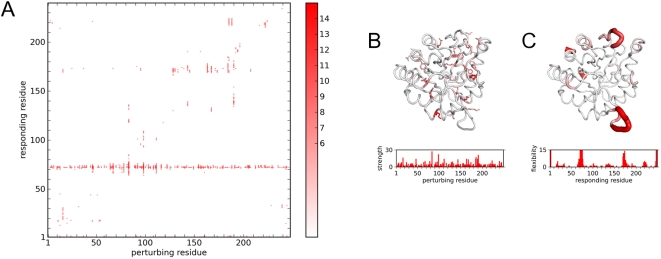
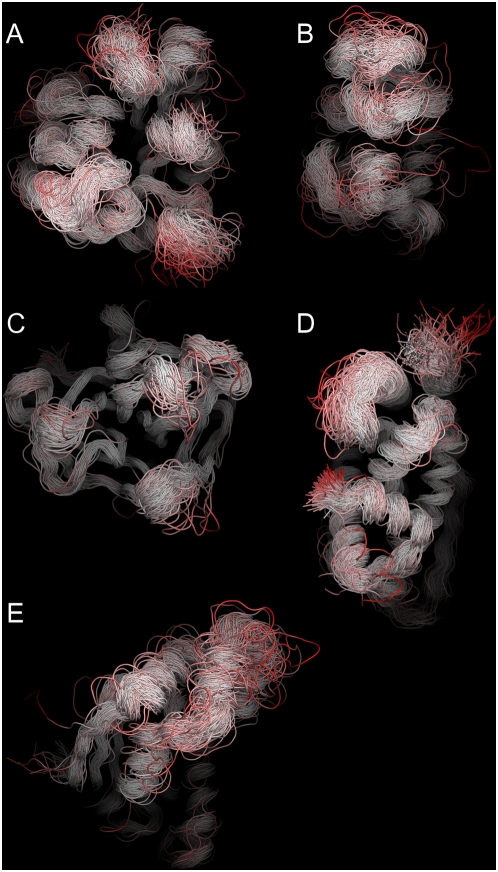
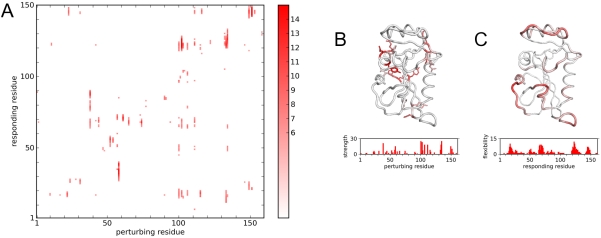
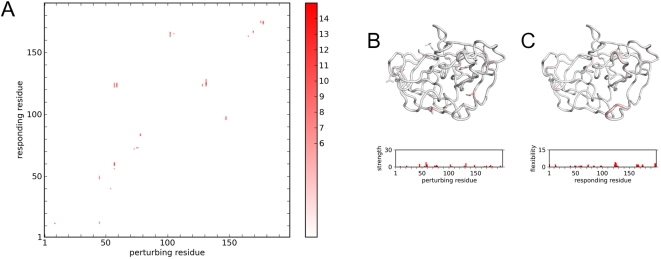
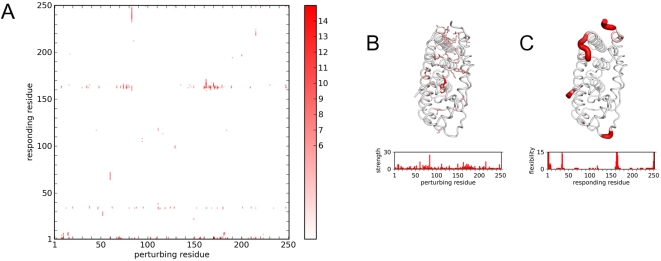
Protein conformational changes and dynamic behavior are fundamental for such processes as catalysis, regulation, and substrate recognition. Although protein dynamics have been successfully explored in computer simulation, there is an intermediate-scale of motions that has proven difficult to simulate - the motion of individual segments or domains that move independently of the body the protein. Here, we introduce a molecular-dynamics perturbation method, the Rotamerically Induced Perturbation (RIP), which can generate large, coherent motions of structural elements in picoseconds by applying large torsional perturbations to individual sidechains. Despite the large-scale motions, secondary structure elements remain intact without the need for applying backbone positional restraints. Owing to its computational efficiency, RIP can be applied to every residue in a protein, producing a global map of deformability. This map is remarkably sparse, with the dominant sites of deformation generally found on the protein surface. The global map can be used to identify loops and helices that are less tightly bound to the protein and thus are likely sites of dynamic modulation that may have important functional consequences. Additionally, they identify individual residues that have the potential to drive large-scale coherent conformational change. Applying RIP to two well-studied proteins, Dihdydrofolate Reductase and Triosephosphate Isomerase, which possess functionally-relevant mobile loops that fluctuate on the microsecond/millisecond timescale, the RIP deformation map identifies and recapitulates the flexibility of these elements. In contrast, the RIP deformation map of alpha-lytic protease, a kinetically stable protein, results in a map with no significant deformations. In the N-terminal domain of HSP90, the RIP deformation map clearly identifies the ligand-binding lid as a highly flexible region capable of large conformational changes. In the Estrogen Receptor ligand-binding domain, the RIP deformation map is quite sparse except for one large conformational change involving Helix-12, which is the structural element that allosterically links ligand binding to receptor activation. RIP analysis has the potential to discover sites of functional conformational changes and the linchpin residues critical in determining these conformational states.
Conflict of interest statement
The authors have declared that no competing interests exist.
Figures
Similar articles
-
Similarity in Shape Dictates Signature Intrinsic Dynamics Despite No Functional Conservation in TIM Barrel Enzymes.PLoS Comput Biol. 2016 Mar 25;12(3):e1004834. doi: 10.1371/journal.pcbi.1004834. eCollection 2016 Mar. PLoS Comput Biol. 2016. PMID: 27015412 Free PMC article.
-
Folding funnels and conformational transitions via hinge-bending motions.Cell Biochem Biophys. 1999;31(2):141-64. doi: 10.1007/BF02738169. Cell Biochem Biophys. 1999. PMID: 10593256 Review.
-
Perturbation Approaches for Exploring Protein Binding Site Flexibility to Predict Transient Binding Pockets.J Chem Theory Comput. 2016 Aug 9;12(8):4100-13. doi: 10.1021/acs.jctc.6b00101. Epub 2016 Jul 25. J Chem Theory Comput. 2016. PMID: 27399277
-
Refined 1.83 A structure of trypanosomal triosephosphate isomerase crystallized in the presence of 2.4 M-ammonium sulphate. A comparison with the structure of the trypanosomal triosephosphate isomerase-glycerol-3-phosphate complex.J Mol Biol. 1991 Aug 20;220(4):995-1015. doi: 10.1016/0022-2836(91)90368-g. J Mol Biol. 1991. PMID: 1880808
-
Simulation analysis of triose phosphate isomerase: conformational transition and catalysis.Faraday Discuss. 1992;(93):239-48. doi: 10.1039/fd9929300239. Faraday Discuss. 1992. PMID: 1290934 Review.
Cited by
-
Crystallographic and nuclear magnetic resonance evaluation of the impact of peptide binding to the second PDZ domain of protein tyrosine phosphatase 1E.Biochemistry. 2010 Nov 2;49(43):9280-91. doi: 10.1021/bi101131f. Biochemistry. 2010. PMID: 20839809 Free PMC article.
-
Quantifying Correlations Between Allosteric Sites in Thermodynamic Ensembles.J Chem Theory Comput. 2009 Sep 8;5(9):2486-2502. doi: 10.1021/ct9001812. J Chem Theory Comput. 2009. PMID: 20161451 Free PMC article.
-
Structure and dynamics of pteridine reductase 1: the key phenomena relevant to enzyme function and drug design.Eur Biophys J. 2023 Oct;52(6-7):521-532. doi: 10.1007/s00249-023-01677-6. Epub 2023 Aug 22. Eur Biophys J. 2023. PMID: 37608196 Free PMC article. Review.
-
The underappreciated role of allostery in the cellular network.Annu Rev Biophys. 2013;42:169-89. doi: 10.1146/annurev-biophys-083012-130257. Epub 2013 Feb 28. Annu Rev Biophys. 2013. PMID: 23451894 Free PMC article. Review.
-
Synthetic biology: tools to design, build, and optimize cellular processes.J Biomed Biotechnol. 2010;2010:130781. doi: 10.1155/2010/130781. Epub 2010 Jan 27. J Biomed Biotechnol. 2010. PMID: 20150964 Free PMC article. Review.
References
-
- Henzler-Wildman K, Kern D. Dynamic personalities of proteins. Nature. 2007;450:964–972. - PubMed
-
- Duan Y, Kollman PA. Pathways to a protein folding intermediate observed in a 1-microsecond simulation in aqueous solution. Science. 1998;282:740–744. - PubMed
-
- Arkin IT, Xu HF, Jensen MO, Arbely E, Bennett ER, et al. Mechanism of Na+/H+ antiporting. Science. 2007;317:799–803. - PubMed
-
- Swain JF, Gierasch LM. The changing landscape of protein allostery. Curr Opin Struct Biol. 2006;16:102–108. - PubMed
-
- Vale RD, Milligan RA. The way things move: looking under the hood of molecular motor proteins. Science. 2000;288:88–95. - PubMed
Publication types
MeSH terms
Substances
Grants and funding
LinkOut - more resources
Full Text Sources
Other Literature Sources
Miscellaneous
