. 2009 May;151(5):507-17; discussion 517.
doi: 10.1007/s00701-009-0248-y. Epub 2009 Apr 3.

Imaging of human brain tumor tissue by near-infrared laser coherence tomography

Affiliations

Imaging of human brain tumor tissue by near-infrared laser coherence tomography

H J Böhringer et al. Acta Neurochir (Wien). 2009 May.

Abstract

Introduction: Intraoperative detection of residual tumor remains an important challenge in surgery to treat gliomas. New developments in optical techniques offer non-invasive high-resolution imaging that may integrate well into the workflow of neurosurgical operations. Using an intracranial glioma model, we have recently shown that time domain optical coherence tomography (OCT) allows discrimination of normal brain, diffusely invaded brain tissue, and solid tumor. OCT imaging allowed acquisition of 2D and 3D data arrays for multiplanar analysis of the tumor to brain interface. In this study we have analyzed biopsy specimens of human brain tumors and we present the first feasibility study of intraoperative OCT and post-image acquisition processing for non-invasive imaging of the brain and brain tumor.

Methods: We used a Sirius 713 Tomograph with a superluminescence diode emitting light at a near infrared central wavelength of 1,310 nm and a coherence length of 15 microm. The light is passed through an optical mono mode fiber to a modified OCT adapter containing a lens system with a working distance of 10 cm and an integrated pilot laser. Navigation-registered tumor biopsies were imaged ex vivo and the intraoperative site of optical tissue analysis was registered by marker acquisition using a neuronavigation system.

Results: Optical coherence tomography non-contact measurements of brain and brain tumor tissue produced B-scan images of 4 mm in width and 1.5-2.0 mm in depth at an axial and lateral optical resolution of 15 microm. OCT imaging demonstrated a different microstructure and characteristic signal attenuation profiles of tumor versus normal brain. Post-image acquisition processing and automated detection of the tissue to air interface was used to realign A-scans to compensate for image distortions caused by pulse- and respiration-induced movements of the target volume. Realigned images allowed monitoring of intensity changes within the scan line and facilitated selection of areas for the averaging of A-scans and the calculation of attenuation coefficients for specific regions of interest.

Conclusion: This feasibility study has demonstrated that OCT analysis of the tissue microstructure and light attenuation characteristics discriminate normal brain, areas of tumor infiltrated brain, solid tumor, and necrosis. The working distance of the OCT adapter and the A-scan acquisition rate conceptually allows integration of the OCT applicator into the optical path of the operating microscopes. This would allow a continuous analysis of the resection plain, providing optical tomography, thereby adding a third dimension to the microscopic view and information on the light attenuation characteristics of the tissue.


Figures

Fig. 1
Fig. 1
Fiber optic interferometer implementation for time domain optical coherence tomography. A superluminescence diode (SLD) with a central wavelength of 1,300 nm is used as a light source. The light is passed through a beam splitter and sent to the sample and a phase modulator. Interference of low-coherence light only occurs when the optical path length of the phase modulator and the sample are matched. The sample beam can be scanned along a transverse axis to create a B-scan image and obtain two-, three-, and four-dimensional data arrays
Fig. 2
Fig. 2
Optical coherence tomography (OCT) imaging of native tissue obtained from surgical specimens of human cortex, a glioblastoma WHO grade IV, and a meningioma, and its dural attachment site
Fig. 3
Fig. 3
During resection of a large right temporal glioblastoma WHO grade IV tissue samples were obtained and the biopsy site was documented by acquisition of marker points using a neuronavigation system. The tissue was immediately subjected to OCT analysis and the resection plain was imaged with no further processing of the tissue. a No-contact OCT imaging showed the different signal characteristics of the adjacent cortex, b a zone of signal abnormality close to the contrast-enhancing tumor presumably invaded brain, c the signal intense contrast-enhancing tumor mass, and d the inhomogeneous appearance of necrotic areas. Note, signal intense artefact due to fluid accumulation on the tissue surface (star)
Fig. 4
Fig. 4
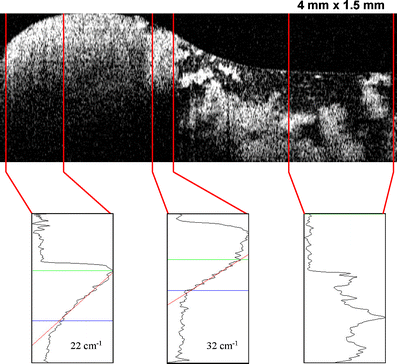
Optical coherence tomography images consist of parallel A-scans along a scan line forming a two-dimensional B-scan image. Analysis of individual A-scans provides depth information on the signal intensity. By curve fitting of the signal intensity along the A-scan a scatter coefficient may be calculated. The shape of scatter curves in areas of brain adjacent to tumor, solid contrast-enhancing tumor, and tumor tissue with micronecrosis were significantly different
Fig. 5
Fig. 5
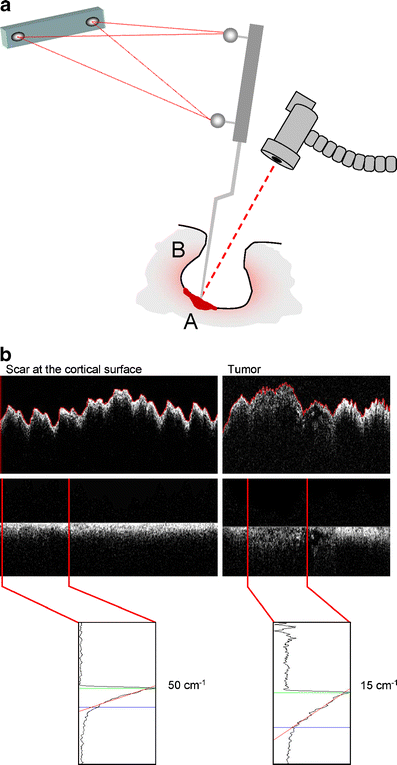
a Illustration of intraoperative OCT measurements. The OCT applicator containing a lens system, a rotating mirror, and a pilot laser, was positioned over the resection cavity using a flexible arm attached to the operating table. Measurements were performed at a fixed working distance of 10 cm by adjusting the distance of the probes to the target tissue. A 4-mm scan line was measured at 0.5 mm/s. The analysis was started in an area of highly cellular known tumor (A) and continued to analysis of the walls of the resection cavity (B). The scanned area was documented by point registration of the center of the scan line using a neuronavigation system. A biopsy of the scanned tissue volume was taken and processed for histological evaluation. b Intraoperative OCT imaging during resection of a recurrent glioblastoma (WHO grade IV). The exposed brain follows a volume change induced by the respiratory and arterial cycle, which at scan times of 1 mm per second for 1.5 s results in characteristic distortion of the tissue. Automated detection of the tissue surface (red line) allows realignment of the A-scans, which can be used to reduce the tissue distortion
Fig. 6
Fig. 6
Intraoperative OCT imaging during resection of glioblastoma (WHO grade IV), which recurred after initial surgery and radiation. A pilot laser was used to focus the OCT probe on the target volume. The center of the scan line was registered by the acquisition of marker points using a neuronavigation system. a Collagen-rich cortical scar H&E stained (left) with deposition of iron pigmented macrophages (right; Berlin blue reaction). b Micro-cystic changes within the tumor infiltration zone. c Highly cellular tumor with vascular proliferations and pleomorphic tumor cells. d Pleomorphic tumor cells (right) and tumor necrosis (left) within the center of the tumor (b–d; H&E staining)
Fig. 7
Fig. 7
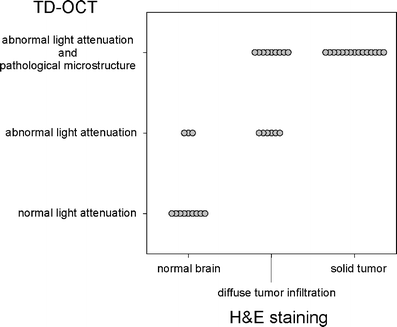
Correlation of intraoperative OCT analysis and postoperative standard histology. Forty-one optical tissue analyses were performed during the operations of 9 malignant gliomas. A blinded investigator scored the stored OCT image files and the scores were compared with those of the blinded evaluation of H&E-stained biopsy specimens

Similar articles

Cited by

References

    1. Albert FK, Forsting M, Sartor K, Adams HP, Kunze S. Early postoperative magnetic resonance imaging after resection of malignant glioma: objective evaluation of residual tumor and its influence on regrowth and prognosis. Neurosurgery. 1994;34:45–61. doi: 10.1097/00006123-199401000-00008. - DOI - PubMed
    1. Bizheva K, Unterhuber A, Hermann B, Povazay B, Sattmann H, Drexler W, et al. Imaging ex vivo and in vitro brain morphology in animal models with ultrahigh resolution optical coherence tomography. J Biomed Opt. 2004;9:719–724. doi: 10.1117/1.1756920. - DOI - PubMed
    1. Bizheva K, Unterhuber A, Hermann B, Povazay B, Sattmann H, Fercher AF, et al. Imaging ex vivo healthy and pathological human brain tissue with ultra-high-resolution optical coherence tomography. J Biomed Opt. 2005;10:011006. doi: 10.1117/1.1851513. - DOI - PubMed
    1. Böhringer HJ, Boller D, Leppert J, Knopp U, Lankenau E, Reusche E, et al. Time domain and spectral domain optical coherence tomography in the analysis of brain tumor tissue. Lasers Surg Med. 2006;38:588–597. doi: 10.1002/lsm.20353. - DOI - PubMed
    1. Böhringer HJ, Lankenau E, Rohde V, Hüttmann G, Giese A. Optical coherence tomography for experimental neuroendoscopy. Minim Invasive Neurosurg. 2006;49:269–275. doi: 10.1055/s-2006-954574. - DOI - PubMed

Publication types