Review
. 2009 Jun;30(6):1758-71.
doi: 10.1002/hbm.20750.

Task-related gamma-band dynamics from an intracerebral perspective: review and implications for surface EEG and MEG

Affiliations
Review

Task-related gamma-band dynamics from an intracerebral perspective: review and implications for surface EEG and MEG

Karim Jerbi et al. Hum Brain Mapp. 2009 Jun.

Abstract

Although non-invasive techniques provide functional activation maps at ever-growing spatio-temporal precision, invasive recordings offer a unique opportunity for direct investigations of the fine-scale properties of neural mechanisms in focal neuronal populations. In this review we provide an overview of the field of intracranial Electroencephalography (iEEG) and discuss its strengths and limitations and its relationship to non-invasive brain mapping techniques. We discuss the characteristics of invasive data acquired from implanted epilepsy patients using stereotactic-electroencephalography (SEEG) and electrocorticography (ECoG) and the use of spectral analysis to reveal task-related modulations in multiple frequency components. Increasing evidence suggests that gamma-band activity (>40 Hz) might be a particularly efficient index for functional mapping. Moreover, the detection of high gamma activity may play a crucial role in bridging the gap between electrophysiology and functional imaging studies as well as in linking animal and human data. The present review also describes recent advances in real-time invasive detection of oscillatory modulations (including gamma activity) in humans. Furthermore, the implications of intracerebral findings on future non-invasive studies are discussed.


Figures

Figure 1
Figure 1
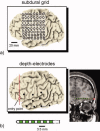
Subdural grids vs. depth electrodes. (a) Representation of electrocorticographic (ECoG) subdural grid electrodes. Open circles indicate recording sites on a 8‐by‐8 matrix covering the lateral surface of the somatosensory cortex. (b) Example of implantation with stereotactic encephalography (SEEG) electrodes. Black dots represent the entry points of ten depth electrodes. Each electrode consists of 5–15 contact sites (green squares). In most cases, SEEG electrodes are inserted orthogonal to the inter‐hemispheric plane as shown on coronal MRI slice.
Figure 2
Figure 2
Illustration of the functional specificity of gamma‐band activity in a word recognition task. Patients had to perform either an animacy decision on written words (Semantic task) or rhyme detection on visually presented pseudo‐words (Phonological task). Time‐frequency (TF) representations show energy increases and decreases relative to pre‐stimulus baseline across the two conditions in three distinct regions: Broca pars triangularis (‘T’), Broca pars opercularis (‘O’) and Ventral Lateral Prefrontal Cortex (‘V’) (response is shown for 2 seconds after stimulus onset). Energy increases above 50 Hz clearly differentiate between task conditions in Broca (‘T’ and ‘O’). Enhanced gamma‐band responses in Broca coincide with gamma‐band suppression in the VLPFC (V). TF maps also display a clear Broca power suppression in all conditions below 30 Hz, i.e., in the alpha and beta bands.
Figure 3
Figure 3
The spatial distribution of alpha, beta, and gamma‐band responses during a visual search task. (a) Paradigm: The patients were asked to search for a gray ‘T’ within an array of distracters (gray ‘L's’). (b) Cortical areas within direct vicinity of electrode sites across all ten patients (green). (c) Following the same convention as in Supplementary Figure 1b, 3D brain reconstructions show the distribution of alpha (8–12 Hz), beta (13–25 Hz) and gamma (50–150 Hz) responses 800 ms after stimulus onset, i.e., while patients are actively searching for the target. Response is expressed in energy variation relative to pre‐stimulus baseline (Wilcoxon Z score, FDR corrected).
Figure 4
Figure 4
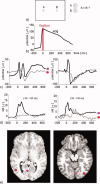
Example study. Free viewing in human early visual areas. (a) Schematic representation of the behavioral task. Stimuli were separated from each other by 10 degrees, centered on the middle of the screen, and had a diameter of 1 degree. Both stimuli were present during the entire trial, which was ended by a behavioral response of “same” or “different” made through a computer mouse. (b) Electroculogram (EOG) recording showing the method used to determine the end of a saccade (fixation onset). (c) ERPs and (d) GBRs as recorded in two electrodes for two patients. Black and gray traces represents the activation recorded from primary visual and latero‐occipital areas. Left and right panels correspond to patient one and two. (e) Magnetic resonance images of a horizontal cut from brains of each patient. Red and magenta dots show the location of the electrode contacts.
Figure 5
Figure 5
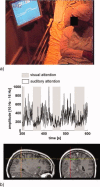
Online measurements of visual attention with Brain TV. (a) The Brain TV set‐up allows patients to visualize ongoing alpha, beta or gamma‐band activity measured in real‐time in specific regions of their brain. (b) Using the set‐up, one patient was able to achieve online control of the activity recorded in her superior parietal lobe within the 10‐16 Hz frequency range. She reported her ability to modulate the activity by focusing her attention on distant visual objects. The subject was then cued to switch between auditory and visual attention. The graph depicts the online variations of the activity as she shifted her attention back and forth between vision (in gray) and audition (in white). These online observations of alpha ERD during visual attention are inline with previous offline studies.

References

    1. Adrian ED ( 1941): Afferent discharges to the cerebral cortex from peripheral sense organs. J Physiol 100: 159–191. - PMC - PubMed
    1. Allison T,Puce A,Spencer DD,McCarthy G ( 1999): Electrophysiological studies of human face perception. I. Potentials generated in occipitotemporal cortex by face and non‐face stimuli. Cereb Cortex 9: 415–430. - PubMed
    1. Aoki F,Fetz EE,Shupe L,Lettich E,Ojemann GA ( 1999): Increased gamma‐range activity in human sensorimotor cortex during performance of visuomotor tasks. Clin Neurophysiol 110: 524–537. - PubMed
    1. Axmacher N,Elger CE,Fell J ( 2008a): Ripples in the medial temporal lobe are relevant for human memory consolidation. Brain 131: 1806–1817. - PubMed
    1. Axmacher N,Schmitz DP,Wagner T,Elger CE,Fell J ( 2008b): Interactions between medial temporal lobe, prefrontal cortex, and inferior temporal regions during visual working memory: A combined intracranial EEG and functional magnetic resonance imaging study. J Neurosci 28: 7304–7312. - PMC - PubMed

Publication types