. 2009 Jul;11(7):1535-45.
doi: 10.1089/ars.2009.2614.

Axonal mitochondrial clusters containing mutant SOD1 in transgenic models of ALS

Affiliations

Axonal mitochondrial clusters containing mutant SOD1 in transgenic models of ALS

Jose R Sotelo-Silveira et al. Antioxid Redox Signal. 2009 Jul.

Abstract

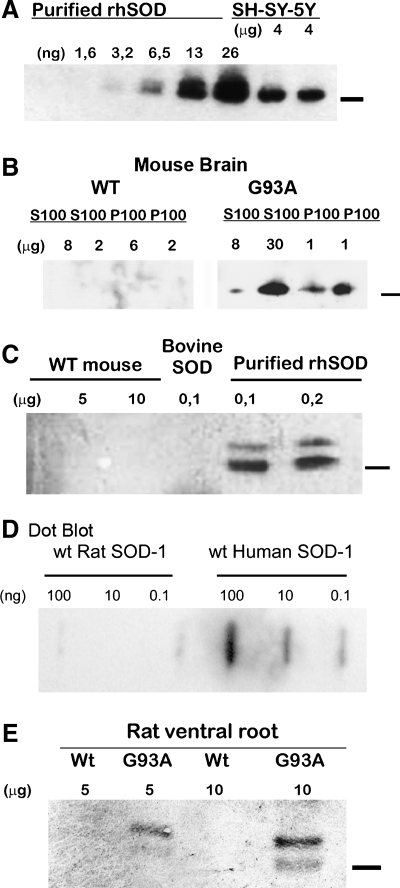
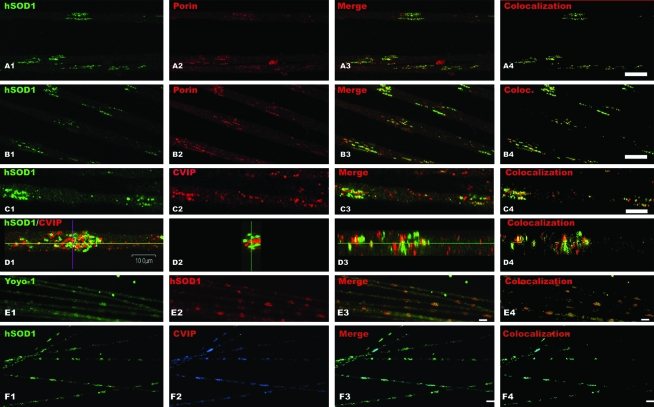
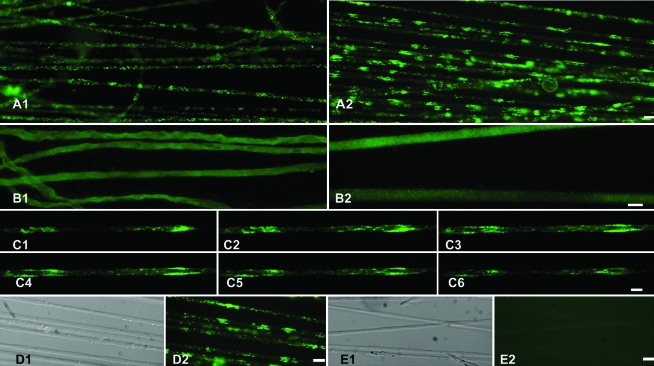
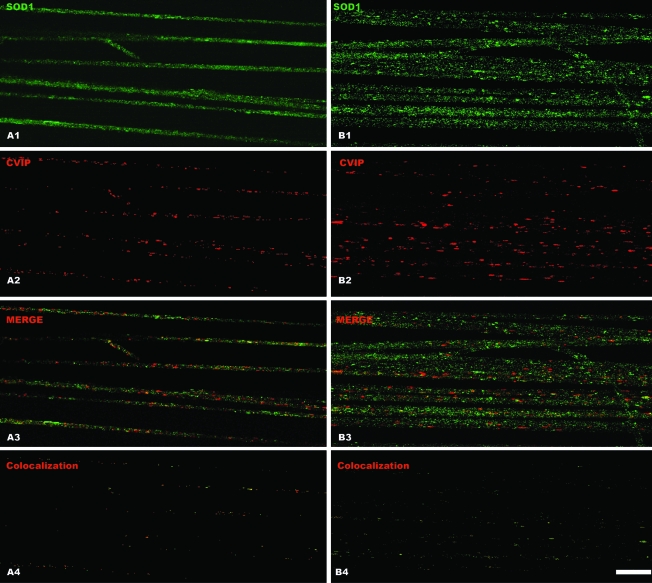
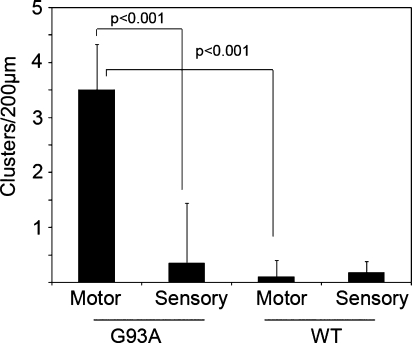
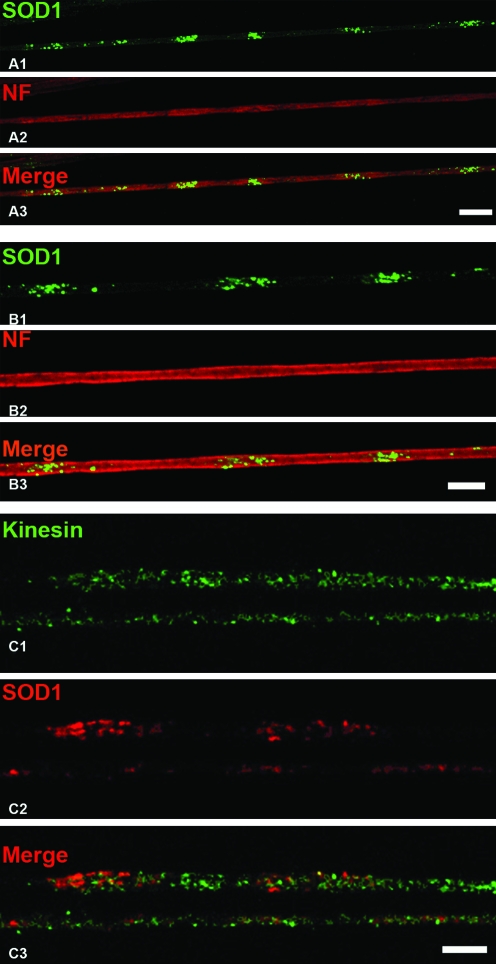
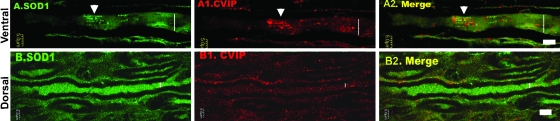
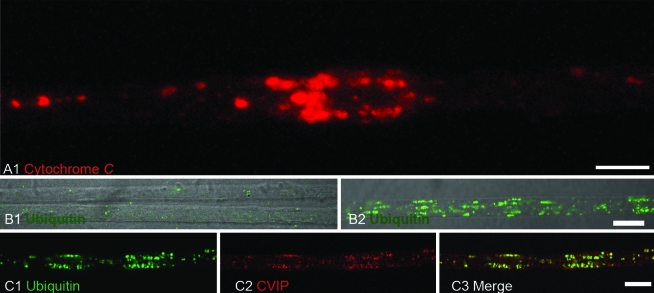
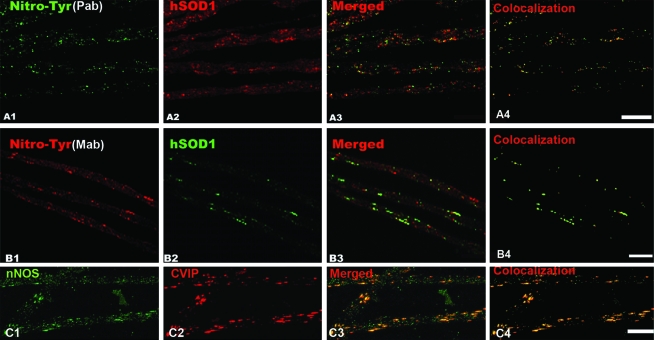
We studied the subcellular distribution of mitochondria and superoxide dismutase-1 (SOD1) in whole mounts of microdissected motor axons of rats expressing the ALS-linked SOD1-G93A mutation. The rationale was to determine whether physical interactions between the enzyme and mitochondria were linked to the axonopathy of motor fibers occurring in amyotrophic lateral sclerosis (ALS). Mitochondria and SOD1 displayed a homogeneous distribution along motor axons both in nontransgenic rats and in those overexpressing wild-type SOD1. In contrast, axons from SOD1-G93A rats (older than 35 days) showed accumulation of mitochondria in discrete clusters located at regular intervals. Most of SOD1 immunoreactivity was enriched in these clusters and colocalized with mitochondria, suggesting a recruitment of SOD1-G93A to the organelle. The SOD1/mitochondrial clusters were abundant in motor axons but scarcely seen in sensory axons. Clusters also were stained for neuronal nitric oxide synthase, nitrotyrosine, and cytochrome c. The later also was detected surrounding clusters. Ubiquitin colocalized with clusters only at late stages of the disease. The cytoskeleton was not overtly altered in clusters. These results suggest that mutant SOD1 and defective mitochondria create localized dysfunctional domains in motor axons, which may lead to progressive axonopathy in ALS.


Figures

FIG. 1.
FIG. 1.
Characterization of the antibody against human SOD1. Human, rat, mouse, and bovine protein extracts were used to demonstrate the specificity of antihuman SOD1 antibody after immunopurification in SDS-PAGE and dot blots. (A) The antibody recognized increasing concentrations of recombinant human SOD1 (rhSOD1) or protein extracts from human neuroblastoma cell line SH-SY-5Y. (B) The antibody recognized soluble and insoluble forms of human SOD1 from transgenic mice in pellets (P100) and supernatants (S100) from 100,000 g centrifugation extracts. (C) The antibody recognized recombinant human SOD1 but not commercial bovine SOD1. (D) Dot-blot with different concentrations of HPLC-purified wild-type rat and human SOD1 (0.1–100 ng). (E) Human SOD1 was detected specifically on ventral roots extracts. Bars to the right of Western blots indicate the 16.5-kDa molecular mass marker.
FIG. 2.
FIG. 2.
Mitochondrial clusters colocalize with SOD1-G93A in motor axon of transgenic rats. Mitochondria and human SOD1 distribution in axons was analyzed in motor axonal whole mounts isolated from 65-day-old SOD1-G93A transgenic animals. Mitochondria were detected by using antibodies against porin, an outer-membrane protein, CVIP (complex five inhibitory protein), mitochondrial membrane protein, and YOYO-1 binding to mitochondrial nucleic acids. (A, B) Mitochondrial porin (red, A2, B2) and SOD1-G93A (green, A1, B1) staining in a single confocal section. Note the high degree of colocalization of both proteins in merged images (A3). (B) Areas in which mitochondria did not display SOD1 staining (red spots on merged image, B3). (C) CVIP immunoreactivity also showed clustering of mitochondria. (C1) Confocal section showing SOD1 staining; (C) CVIP staining; and (C3) merged images. (D1) Set of confocal images of the same focal plane for SOD1 and CVIP (human SOD1, green; CVIP, red). (D2) and (D3) are two different optical planes (blue line and yellow line of the axon visualized in D1) showing a large mitochondrial/SOD1 cluster. (E) DNA/RNA contents in clusters as showed by YOYO-1 staining (E1); (E2) human SOD1 immunoreactivity; (E3) merged image. (F) Mitochondria/SOD1 clusters in motor axons from SOD1-G93A mice. (F1) SOD1-G93A staining (green); (F2) CVIP staining, and (F3) merged image. Scale bars: for (A) to (D): 10 μm; (E) 5 μm; (F) 20 μm. The column to the right in each series shows green and red pixels that colocalize according to Costes criteria (see Materials and Methods). (For interpretation of the references to color in this figure legend, the reader is referred to the web version of this article at www.liebertonline.com/ars).
FIG. 3.
FIG. 3.
Morphologic characterization of SOD1-G93A clusters in sensory and motor axons of asymptomatic rats. (A1) SOD1-G93A detected with immunofluorescence in lumbar sensory axons from 65-day-old SOD1-G93A rats. Note that no clusters were observed. (A2) SOD1-G93A detected in the ventral root at the same root level and from the same animal. Note the striking density of clusters. (B) Distribution of wild-type rat SOD1 in non-transgenic control littermates, as detected by using a panspecific anti-SOD1. (B1) Dorsal sensory axons; (B2) ventral motor axons. Note the homogeneous distribution of rat SOD1. (C1–C6) Six consecutive confocal images of 35-day-old SOD1-G93A motor axons showing SOD1 distribution through the axonal volume. (D1) Differential interference contrast (DIC) image; and (D2) SOD1-G93A staining of axons displaying clusters. Note that the affected axons were not morphologically altered. (E1) DIC image, and (E2) anti-human SOD1 staining of non-transgenic motor axons. Note the lack of immunoreactivity of rat SOD1. Scale bars: A, D, and E, 20 μm; B and C, 10 μm. (For interpretation of the references to color in this figure legend, the reader is referred to the web version of this article at www.liebertonline.com/ars).
FIG. 4.
FIG. 4.
Lack of mitochondria clustering in motor axons from rats overexpressing wild-type human SOD1. Motor axons were microdissected from 65-day-old rats overexpressing wild-type human SOD1 and stained to detect the human SOD1 protein (green) or CVIP mitochondrial protein (red). (A1–4) The signal obtained from a single confocal section of motor axons, whereas (B1–4) show a projection of multiple Z optical sections of several motor axons. Note the low degree of colocalization in (A4) and (B4), even when several optical sections were projected in the same plane (B4). Scale bar, 100 μm. (For interpretation of the references to color in this figure legend, the reader is referred to the web version of this article at www.liebertonline.com/ars).
FIG. 5.
FIG. 5.
Quantification of cluster density. Clusters were counted as described in Materials and Methods and expressed as number per the indicated axon segment. Note the difference between SOD1-G93A and wild-type SOD1 motor axons. The difference in cluster density between SOD1-G93A motor and sensory axons and WT SOD1 motor axons was statistically significant (p < 0.001) when the indicated pairs were compared. No difference was found between motor and sensory axons from WT hSOD1 animals. Error bars correspond to standard deviation (SD).
FIG. 6.
FIG. 6.
Cytoskeletal and transport elements are distributed uniformly across SOD1 clusters. Motor axons from 65-day-old animals were dissected and stained to detect the mayor subunit of neurofilaments (NF) and kinesins I–II by using confocal microscopy. (A, B) NF-H staining in single confocal sections of two different areas at different magnifications. No major alterations are seen in areas of SOD1 clusters (green). Bars, 10 μm. (C) A portion of two motor axons is shown bearing an accumulation of SOD1-G93A but no colocalization with kinesin. In addition, the distribution of kinesin was not overtly altered in motor fibers. Scale bar, 10 μm. (For interpretation of the references to color in this figure legend, the reader is referred to the web version of this article at www.liebertonline.com/ars).
FIG. 7.
FIG. 7.
Mitochondrial/SOD1 clusters are found in conventional tissue cryosections of the ventral root. The microphotographs shows 0.5-μm confocal sections of longitudinal cryosections of the roots stained with anti-human SOD1 (green) and CVIP (red). (A) and (A2) depict a myelinated axon from a ventral root (65-day-old SOD-G93A rat), where a cluster is indicated with an arrowhead. (B) to (B2) show a dorsal root where both mitochondria and SOD1 immunoreactivity were distributed evenly across the axons. Although SOD1-G93A was expressed in Schwann cells, no clusters were observed in these cells. Vertical bars, axon core. Scale bars, 5 μm. (For interpretation of the references to color in this figure legend, the reader is referred to the web version of this article at www.liebertonline.com/ars).
FIG. 8.
FIG. 8.
Cytochrome c and ubiquitin immunoreactivity in motor axons from SOD1-G93A rats. (A) Cytochrome c (red) labelling followed the pattern of mitochondria distribution. Note the diffuse pattern of staining surrounding the mitochondria clusters, suggesting release of the protein due to organelle damage. (B) Comparison of ubiquitin immunoreactivity between 65-day-old axons (B) and 100-day-old axons (B1). In both cases, the image was obtained by merging DIC and confocal images. Bar, 10 μm. Note that ubiquitin staining in non-transgenic motor axons is comparable to that in 65-day-old SOD1-G93A rats. (C) Ubiquitin (green) was detected together with mitochondria (red) in a motor axon from a 110-day-old SOD1-G93A rat. Scale bars (B) and (C), 10 μm. (For interpretation of the references to color in this figure legend, the reader is referred to the web version of this article at www.liebertonline.com/ars).
FIG. 9.
FIG. 9.
Nitrotyrosine and NOS immunoreactivity in clusters of motor axons expressing SOD1-G93A. (A) Nitrotyrosine (A1, green) was detected with a polyclonal antibody and mitochondria by using CVIP antibody (A2, red). The merged image is seen in (A3). (B) Nitrotyrosine (B1, red) was detected with a monoclonal antibody (clone 1A6) and colocalized with SOD1-G93A (B2, green). The merged image is shown in (B3). (C) nNOS immunoreactivity (C1) colocalized with mitochondria (C2, CVIP). (A4), (B4), and (C4) show pixel colocalization masks obtained for each respective probe pair. In both cases, axons were microdissected from 65-day-old SOD1-G93A rats. Scale bars, 10 μm. (For interpretation of the references to color in this figure legend, the reader is referred to the web version of this article at www.liebertonline.com/ars).

Similar articles

Cited by

References

    1. Abe K. Pan LH. Watanabe M. Kato T. Itoyama Y. Induction of nitrotyrosine-like immunoreactivity in the lower motor neuron of amyotrophic lateral sclerosis. Neurosci Lett. 1995;199:152–154. - PubMed
    1. Alvarez B. Demicheli V. Duran R. Trujillo M. Cervenansky C. Freeman BA. Radi R. Inactivation of human Cu,Zn superoxide dismutase by peroxynitrite and formation of histidinyl radical. Free Radic Biol Med. 2004;37:813–822. - PubMed
    1. Andersen PM. Genetics of sporadic ALS. Amyotroph Lateral Scler Other Motor Neuron Disord. 2001;2(suppl 1):S37–S41. - PubMed
    1. Basso M. Massignan T. Samengo G. Cheroni C. De Biasi S. Salmona M. Bendotti C. Bonetto V. Insoluble mutant SOD1 is partly oligoubiquitinated in amyotrophic lateral sclerosis mice. J Biol Chem. 2006;281:33325–33335. - PubMed
    1. Beckman JS. Estevez AG. Crow JP. Barbeito L. Superoxide dismutase and the death of motoneurons in ALS. Trends Neurosci. 2001;24:S15–S20. - PubMed

Publication types