

The evolution of isochore patterns in vertebrate genomes
- PMID: 19344507
- PMCID: PMC2678159
- DOI: 10.1186/1471-2164-10-146
The evolution of isochore patterns in vertebrate genomes
Abstract
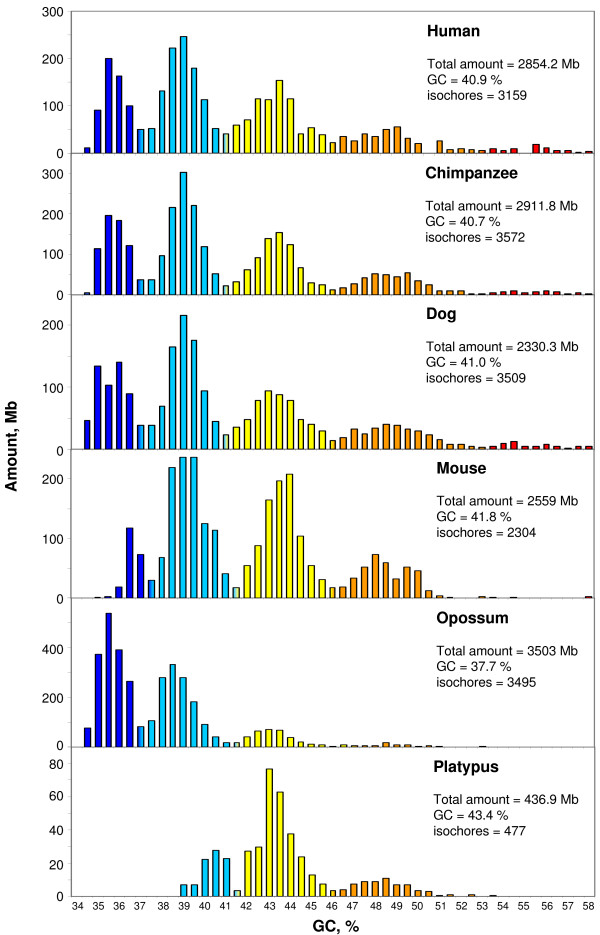
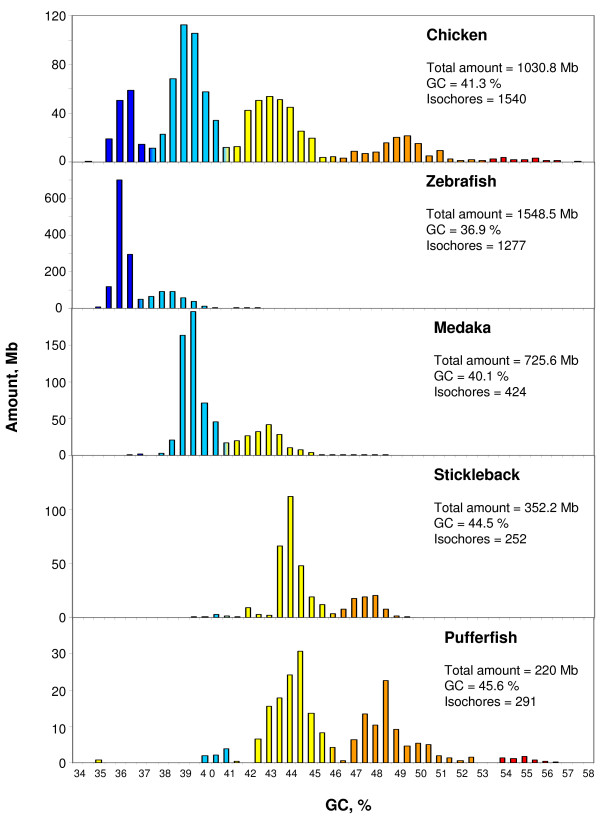
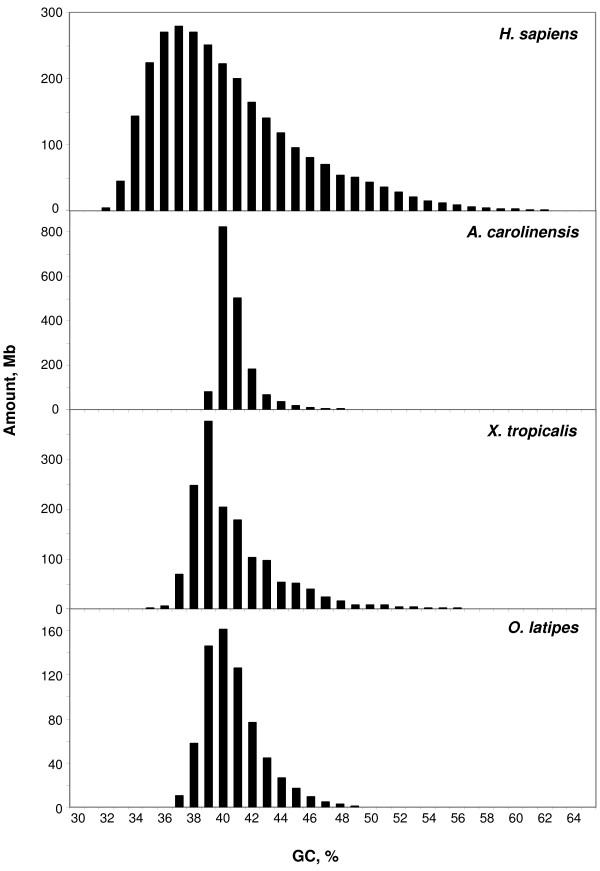
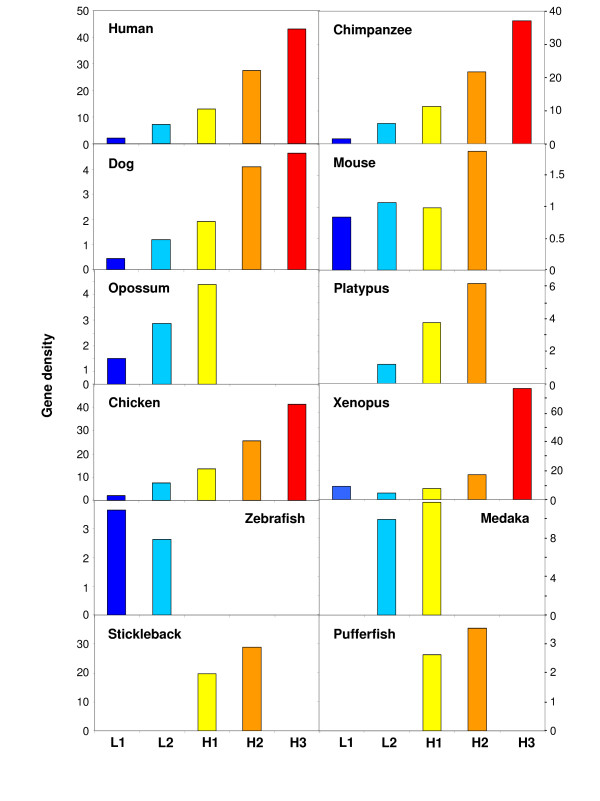
Background: Previous work from our laboratory showed that (i) vertebrate genomes are mosaics of isochores, typically megabase-size DNA segments that are fairly homogeneous in base composition; (ii) isochores belong to a small number of families (five in the human genome) characterized by different GC levels; (iii) isochore family patterns are different in fishes/amphibians and mammals/birds, the latter showing GC-rich isochore families that are absent or very scarce in the former; (iv) there are two modes of genome evolution, a conservative one in which isochore patterns basically do not change (e.g., among mammalian orders), and a transitional one, in which they do change (e.g., between amphibians and mammals); and (v) isochores are tightly linked to a number of basic biological properties, such as gene density, gene expression, replication timing and recombination.
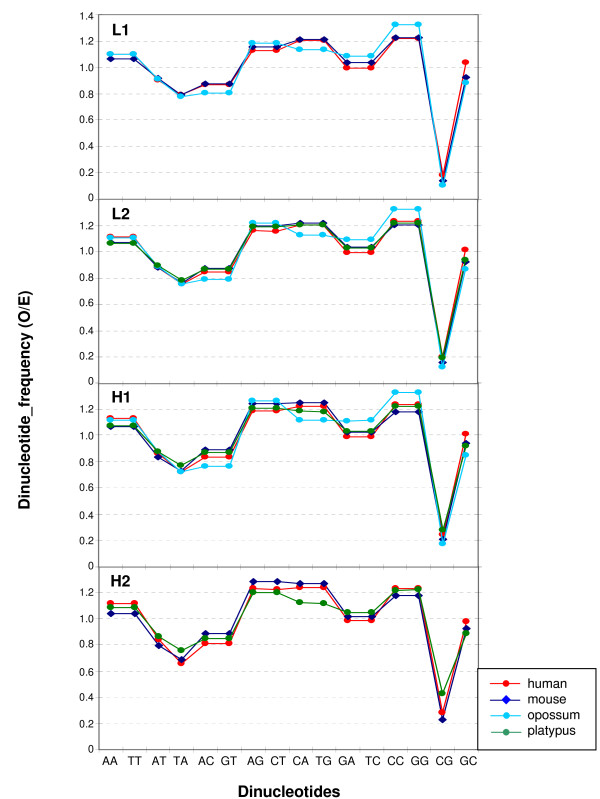
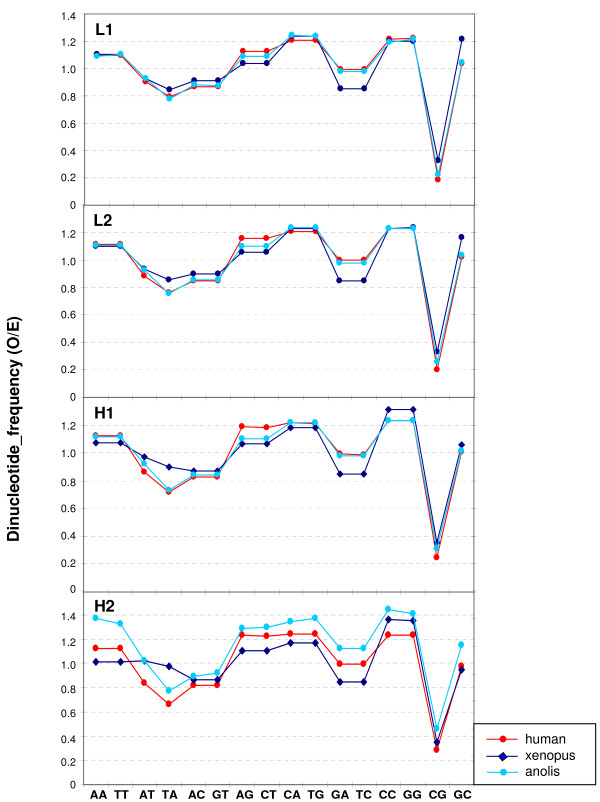
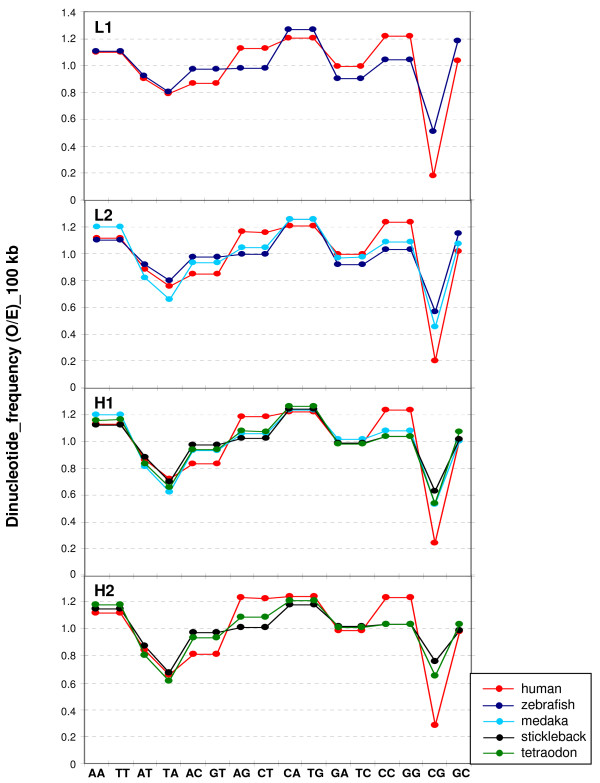
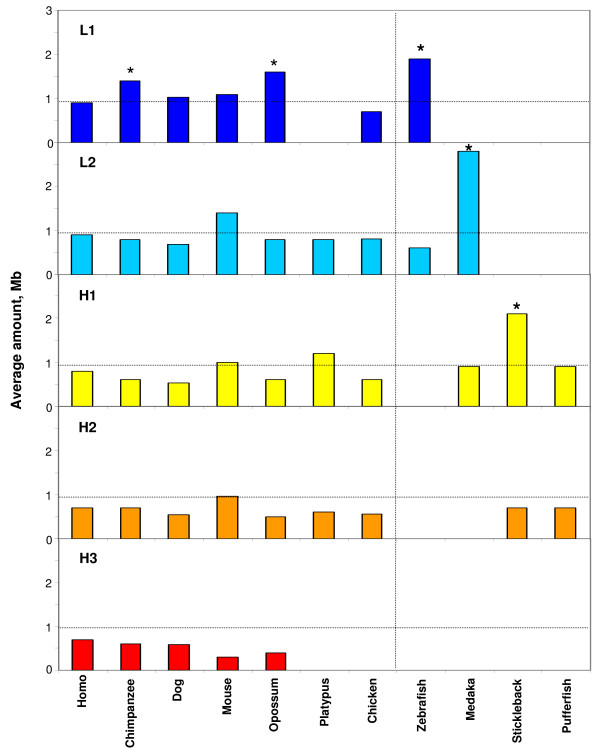
Results: The present availability of a number of fully sequenced genomes ranging from fishes to mammals allowed us to carry out investigations that (i) more precisely quantified our previous conclusions; (ii) showed that the different isochore families of vertebrate genomes are largely conserved in GC levels and dinucleotide frequencies, as well as in isochore size; and (iii) isochore family patterns can be either conserved or change within both warm- and cold-blooded vertebrates.
Conclusion: On the basis of the results presented, we propose that (i) the large conservation of GC levels and dinucleotide frequencies may reflect the conservation of chromatin structures; (ii) the conservation of isochore size may be linked to the role played by isochores in chromosome structure and replication; (iii) the formation, the maintainance and the changes of isochore patterns are due to natural selection.
Figures
Similar articles
-
The vertebrate genome: isochores and evolution.Mol Biol Evol. 1993 Jan;10(1):186-204. doi: 10.1093/oxfordjournals.molbev.a039994. Mol Biol Evol. 1993. PMID: 8450755 Review.
-
Isochore patterns and gene distributions in fish genomes.Genomics. 2007 Sep;90(3):364-71. doi: 10.1016/j.ygeno.2007.05.006. Epub 2007 Jun 21. Genomics. 2007. PMID: 17590311
-
The isochore patterns of invertebrate genomes.BMC Genomics. 2009 Nov 18;10:538. doi: 10.1186/1471-2164-10-538. BMC Genomics. 2009. PMID: 19922632 Free PMC article.
-
Patterns of vertebrate isochore evolution revealed by comparison of expressed mammalian, avian, and crocodilian genes.J Mol Evol. 2007 Sep;65(3):259-66. doi: 10.1007/s00239-007-9003-2. Epub 2007 Aug 3. J Mol Evol. 2007. PMID: 17674077
-
The Isochores as a Fundamental Level of Genome Structure and Organization: A General Overview.J Mol Evol. 2017 Mar;84(2-3):93-103. doi: 10.1007/s00239-017-9785-9. Epub 2017 Feb 27. J Mol Evol. 2017. PMID: 28243687 Review.
Cited by
-
DNA replication timing.Cold Spring Harb Perspect Biol. 2013 Aug 1;5(8):a010132. doi: 10.1101/cshperspect.a010132. Cold Spring Harb Perspect Biol. 2013. PMID: 23838440 Free PMC article. Review.
-
Comparative RNA-Seq analysis reveals pervasive tissue-specific alternative polyadenylation in Caenorhabditis elegans intestine and muscles.BMC Biol. 2015 Jan 20;13:4. doi: 10.1186/s12915-015-0116-6. BMC Biol. 2015. PMID: 25601023 Free PMC article.
-
The Anolis Lizard Genome: An Amniote Genome without Isochores?Genome Biol Evol. 2016 Apr 13;8(4):1048-55. doi: 10.1093/gbe/evw056. Genome Biol Evol. 2016. PMID: 26992416 Free PMC article.
-
Immunocytological analysis of meiotic recombination in two anole lizards (Squamata, Dactyloidae).Comp Cytogenet. 2017 Mar 6;11(1):129-141. doi: 10.3897/CompCytogen.v11i1.10916. eCollection 2017. Comp Cytogenet. 2017. PMID: 28919954 Free PMC article.
-
GC heterogeneity reveals sequence-structures evolution of angiosperm ITS2.BMC Plant Biol. 2023 Dec 1;23(1):608. doi: 10.1186/s12870-023-04634-9. BMC Plant Biol. 2023. PMID: 38036992 Free PMC article.
References
-
- Bernardi G. Structural and Evolutionary Genomics Natural Selection in Genome Evolution. Elsevier, Amsterdam, The Netherlands; 2004.
MeSH terms
Substances
LinkOut - more resources
Full Text Sources
Miscellaneous
