

Easier surveillance of climate-related health vulnerabilities through a Web-based spatial OLAP application
- PMID: 19344512
- PMCID: PMC2672060
- DOI: 10.1186/1476-072X-8-18
Easier surveillance of climate-related health vulnerabilities through a Web-based spatial OLAP application
Abstract
Background: Climate change has a significant impact on population health. Population vulnerabilities depend on several determinants of different types, including biological, psychological, environmental, social and economic ones. Surveillance of climate-related health vulnerabilities must take into account these different factors, their interdependence, as well as their inherent spatial and temporal aspects on several scales, for informed analyses. Currently used technology includes commercial off-the-shelf Geographic Information Systems (GIS) and Database Management Systems with spatial extensions. It has been widely recognized that such OLTP (On-Line Transaction Processing) systems were not designed to support complex, multi-temporal and multi-scale analysis as required above. On-Line Analytical Processing (OLAP) is central to the field known as BI (Business Intelligence), a key field for such decision-support systems. In the last few years, we have seen a few projects that combine OLAP and GIS to improve spatio-temporal analysis and geographic knowledge discovery. This has given rise to SOLAP (Spatial OLAP) and a new research area. This paper presents how SOLAP and climate-related health vulnerability data were investigated and combined to facilitate surveillance.
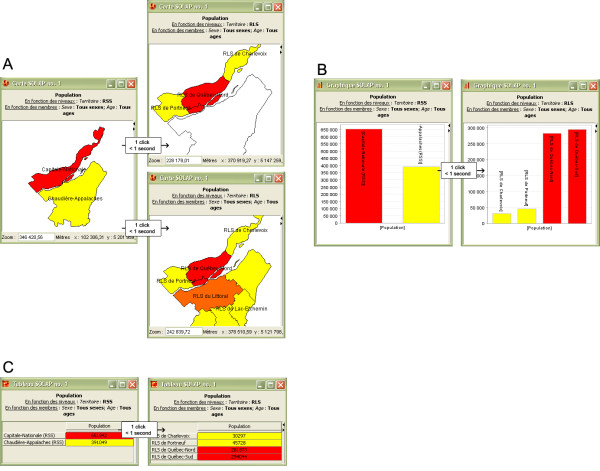
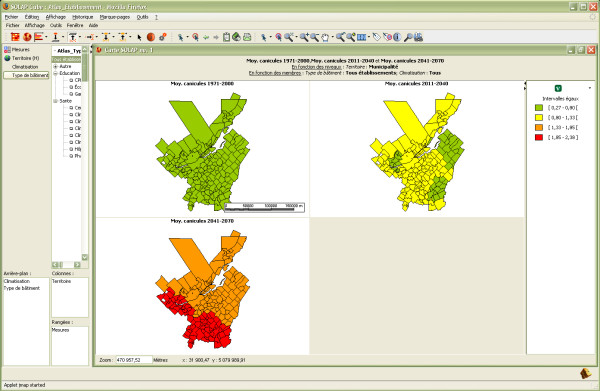
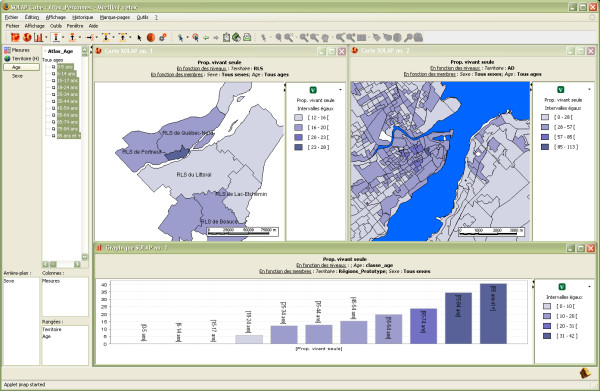
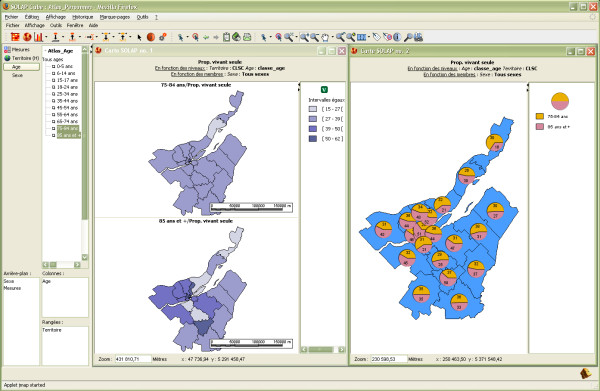
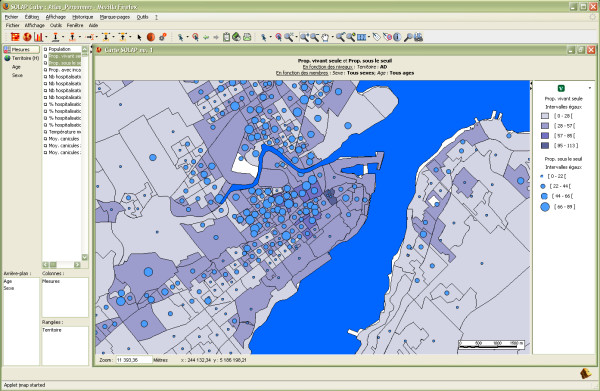
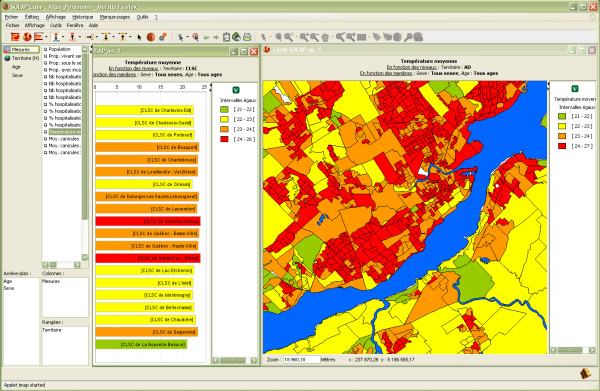
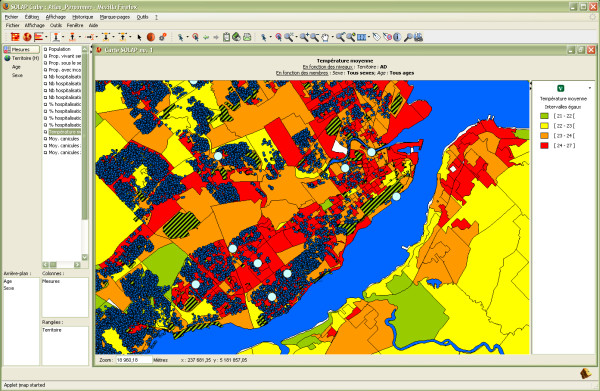
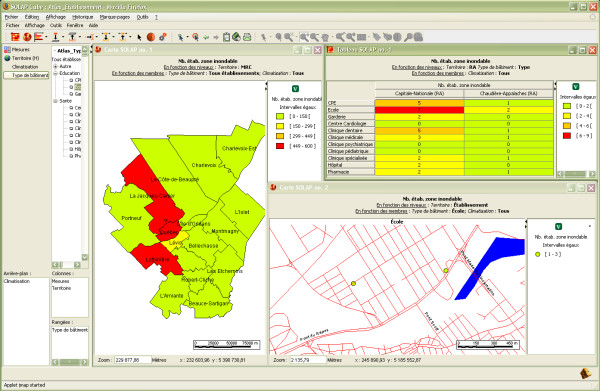
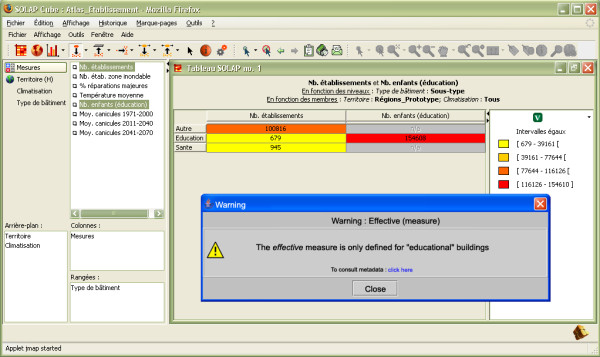
Results: Based on recent spatial decision-support technologies, this paper presents a spatio-temporal web-based application that goes beyond GIS applications with regard to speed, ease of use, and interactive analysis capabilities. It supports the multi-scale exploration and analysis of integrated socio-economic, health and environmental geospatial data over several periods. This project was meant to validate the potential of recent technologies to contribute to a better understanding of the interactions between public health and climate change, and to facilitate future decision-making by public health agencies and municipalities in Canada and elsewhere. The project also aimed at integrating an initial collection of geo-referenced multi-scale indicators that were identified by Canadian specialists and end-users as relevant for the surveillance of the public health impacts of climate change. This system was developed in a multidisciplinary context involving researchers, policy makers and practitioners, using BI and web-mapping concepts (more particularly SOLAP technologies), while exploring new solutions for frequent automatic updating of data and for providing contextual warnings for users (to minimize the risk of data misinterpretation). According to the project participants, the final system succeeds in facilitating surveillance activities in a way not achievable with today's GIS. Regarding the experiments on frequent automatic updating and contextual user warnings, the results obtained indicate that these are meaningful and achievable goals but they still require research and development for their successful implementation in the context of surveillance and multiple organizations.
Conclusion: Surveillance of climate-related health vulnerabilities may be more efficiently supported using a combination of BI and GIS concepts, and more specifically, SOLAP technologies (in that it facilitates and accelerates multi-scale spatial and temporal analysis to a point where a user can maintain an uninterrupted train of thought by focussing on "what" she/he wants (not on "how" to get it) and always obtain instant answers, including to the most complex queries that take minutes or hours with OLTP systems (e.g., aggregated, temporal, comparative)). The developed system respects Newell's cognitive band of 10 seconds when performing knowledge discovery (exploring data, looking for hypotheses, validating models). The developed system provides new operators for easily and rapidly exploring multidimensional data at different levels of granularity, for different regions and epochs, and for visualizing the results in synchronized maps, tables and charts. It is naturally adapted to deal with multiscale indicators such as those used in the surveillance community, as confirmed by this project's end-users.
Figures
References
-
- Intergovernmental Panel On Climate Change (IPCC) Fourth Assessment Report. 2007. http://www.ipcc.ch/ipccreports/ar4-syr.htm
-
- Menne B, Ebi KL. Climate change and adaptation strategies for human health. Published on behalf of the World Health Organization Regional Office for Europe. Germany: Steinkopff Verlag Darmstadt; 2006.
-
- World Health Organisation (WHO-Europe) Public health response to extreme weather and climate event. Fourth Ministerial Conference on Environment and Health Budapest, Hungary. 2004. http://www.euro.who.int/document/gch/edoc13.pdf
-
- Health Canada Canada's Health Concerns from Climate Change and Variability. 2007. http://www.adaptation.nrcan.gc.ca/perspective/health_3_e.php
-
- Bédard Y, Proulx M, Bernier E, Gosselin P. How the new decisional analytical geomatics technologies can help environmental health professionals and decision-makers to make further use of mapping than what is offered traditionally by geographic information systems (GIS) and web mapping. Environmental Health Systematic Review for the National Collaborating Centre for Environmental Health (NCCEH); 2007.
Publication types
MeSH terms
LinkOut - more resources
Full Text Sources
