. 2009 Apr 3:9:33.
doi: 10.1186/1472-6750-9-33.

Optimization of codon composition and regulatory elements for expression of human insulin like growth factor-1 in transgenic chloroplasts and evaluation of structural identity and function

Affiliations

Optimization of codon composition and regulatory elements for expression of human insulin like growth factor-1 in transgenic chloroplasts and evaluation of structural identity and function

Henry Daniell et al. BMC Biotechnol. .

Abstract

Background: Transgenic chloroplasts are potential bioreactors for recombinant protein production, especially for achievement of high levels of protein expression and proper folding. Production of therapeutic proteins in leaves provides transgene containment by elimination of reproductive structures. Therefore, in this study, human Insulin like Growth Factor-1 is expressed in transgenic chloroplasts for evaluation of structural identity and function.

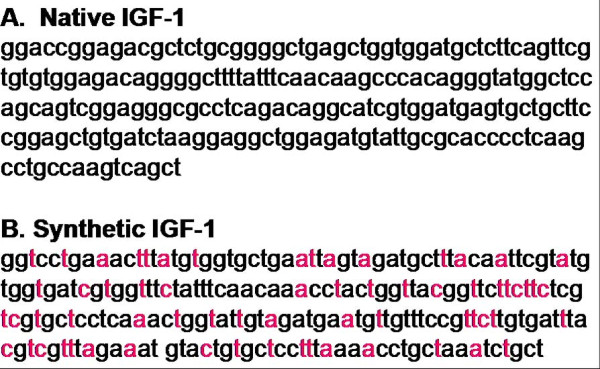
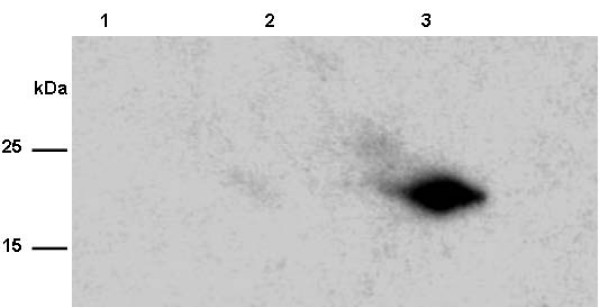
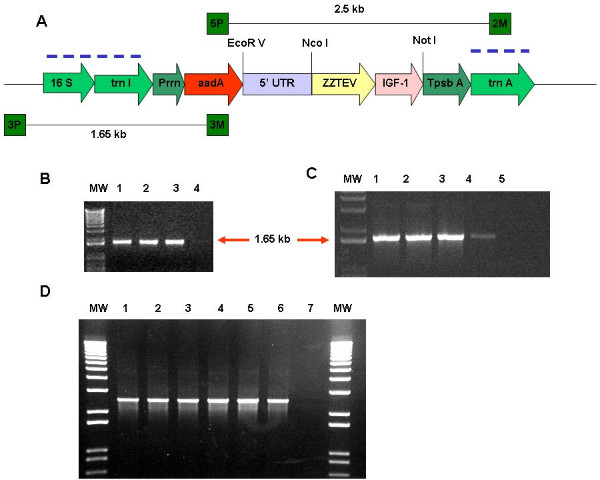
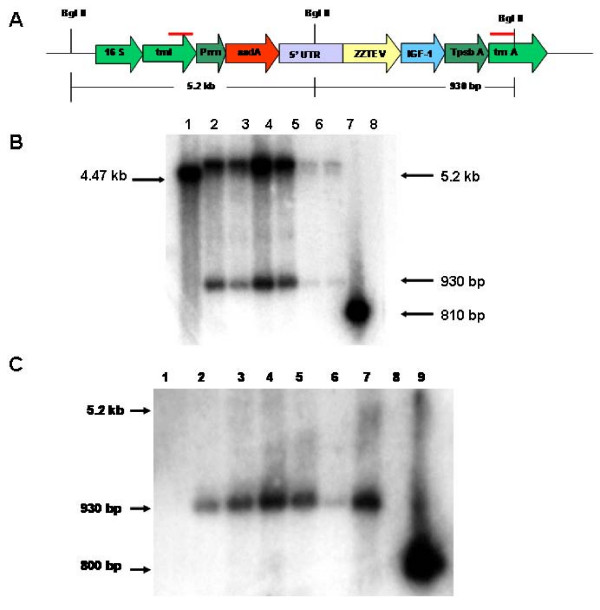
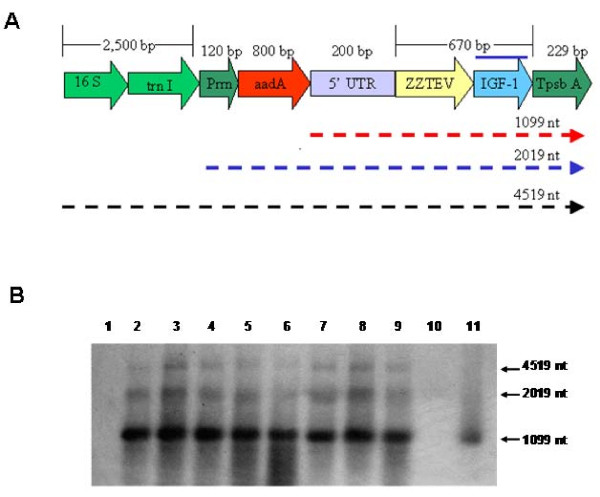
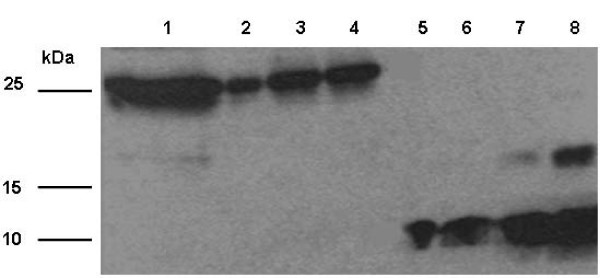
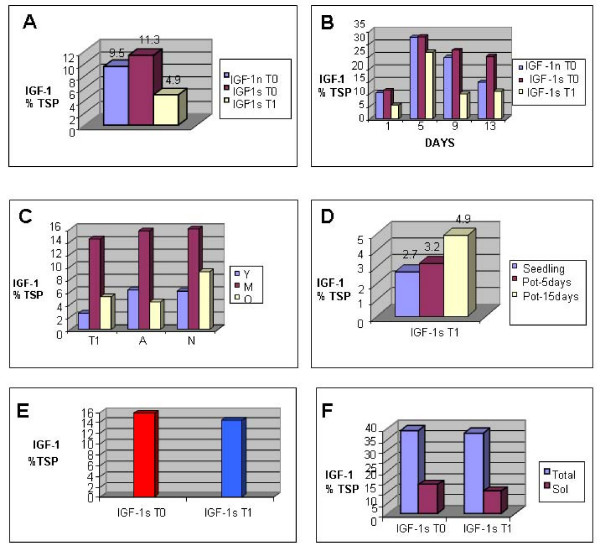
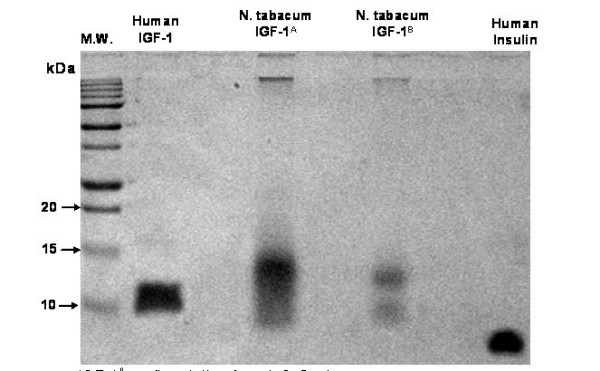
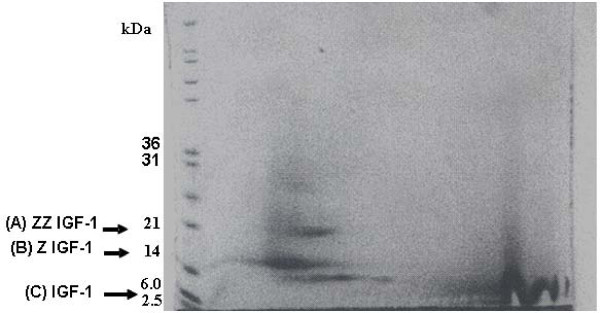
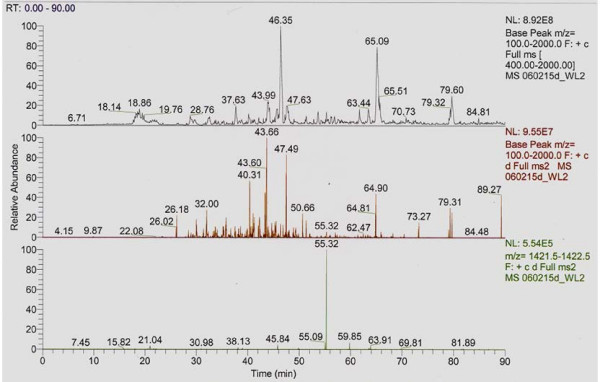
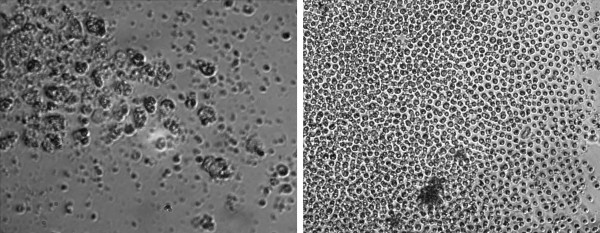
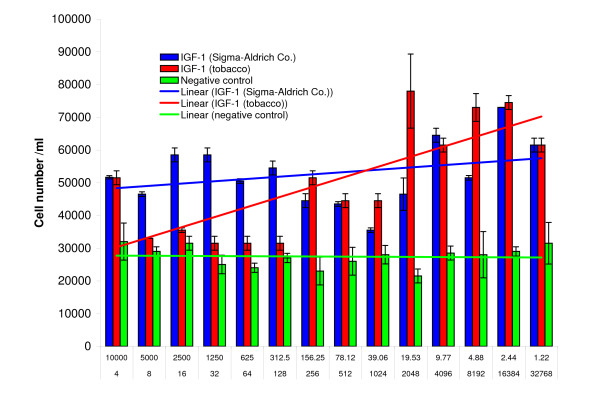
Results: Expression of the synthetic Insulin like Growth Factor 1 gene (IGF-1s, 60% AT) was observed in transformed E. coli. However, no native IGF-1 gene (IGF-1n, 41% AT) product was detected in the western blots in E. coli. Site-specific integration of the transgenes into the tobacco chloroplast genome was confirmed after transformation using PCR. Southern blot analysis confirmed that the transgenic lines were homoplasmic. The transgenic plant lines had IGF-1s expression levels of 11.3% of total soluble protein (TSP). The IGF-1n plants contained 9.5% TSP as IGF-1n, suggesting that the chloroplast translation machinery is more flexible than E. coli in codon preference and usage. The expression of IGF-1 was increased up to 32% TSP under continuous illumination by the chloroplast light regulatory elements. IgG-Sepharose affinity column chromatographic separation of Z domain containing chloroplast derived IGF-1 protein, single and two dimensional electrophoresis methods and mass spectrometer analysis confirmed the identity of human IGF-1 in transgenic chloroplasts. Two spots analyzed from 2-D focusing/phoresis acrylamide gel showed the correct amino acid sequence of human IGF-1 and the S. aureus Z-tag. Cell proliferation assays in human HU-3 cells demonstrated the biological activity of chloroplast derived IGF-1 even in the presence of the S. aureus Z tag.

Conclusion: This study demonstrates that the human Insulin like Growth Factor-1 expressed in transgenic chloroplasts is identical to the native protein and is fully functional. The ability to use plant chloroplasts as bioreactors to generate proteins of great economic value that retain their biological activity is an exciting and achievable goal that appears to be within our grasp.


Figures

Figure 1
Figure 1
Nucleotide sequence of IGF-1 genes. A) Nucleotide sequence of the native IGF-1n gene. B) Nucleotide sequence of the synthetic IGF-1s gene optimized for chloroplast expression. Red letters show nucleotides that were modified in the IGF-1s gene.
Figure 2
Figure 2
IGF-1 Expression in E. coli. Expression of IGF-1 in western blots was detected using mouse anti-human IGF-1. Lane: 1-untransformed E. coli; Lane 2-pLD5'UTRZZTEVIGF-1n; Lane 3: pLD5'UTRZZTEVIGF-1s. The zz tag-TEV-IGF-1 polypeptide has a molecular size of 24 kDa.
Figure 3
Figure 3
Chloroplast vectors and PCR confirmation of transgene integration. A) Two chloroplast expression cassettes were made, one with the IGF-1n gene and another with the IGF-1s gene (for complete sequence, see figure 1). A) The blue dotted lines show regions of homologous recombination with the chloroplast genome. Regulatory sequences used were from the tobacco chloroplast genome: Prrn: 16S rRNA promoter; 5'UTR: the psbA promoter and 5' UTR; 3'UTR: the psbA 3' UTR. The primers 3P & 3M and 5P & 2M were used to confirm the integration of the IGF-1 gene cassette into the chloroplast genome. The primer (3P, 3M or 5P, 2M) landing sites for PCR reactions are shown in green boxes. Transgenic lines should produce a 1.65 kb PCR product with 3P & 3M primers and 2.5 kbp products with 5P & 2M primers. B) Lanes 1–3: IGF-1s transgenic lines; lane 4: Untransformed control. C) Lanes 1–4: IGF-1n transgenic lines; lane 5: Untransformed control. D) Lanes 1–3: transgenic lines with the 5'UTRZZTEVIGF-1s gene cassette; Lanes 4–6: Transgenic lines with the 5'UTRZZTEVIGF-1n gene cassette. Lane 7: Untransformed control. Lanes marked MW show 1 kbp DNA ladder.
Figure 4
Figure 4
Southern blot analysis. A flanking sequence probe (810 bp) was obtained from the trnA/trnI genes (indicated by red lines in 4A). Regulatory and coding sequences are the same as in figure 3A. This map also shows the chloroplast DNA fragment that hybridizes with this probe. Untransformed genome hybridized with a 4.47 kbp fragment whereas transformed chloroplast genomes hybridized with two fragments of 5.2 kbp and 930 bp. B) Lane 1: Untransformed control; Lanes 2–3: IGF-1s transgenic lines (T0 generation); Lanes 4–5: IGF-1s transgenic lines (T1 generation); Lanes 6–7: IGF-1n plants (T0 generation); Lane 8: positive control. C) The IGF-1 coding sequence was used as a probe to confirm integration of the IGF-1 gene into the chloroplast genome. The transgenic lines that contain the IGF-1 show a 930 bp fragment. Lane: 1- untransformed, Lanes 2–3: IGF-1s transgenic lines (T0), 4–5: IGF-1s transgenic lines (T1); 6–7: IGF-1n transgenic lines; Lane 8: blank; Lane 9: the IGF-1 probe as a positive control.
Figure 5
Figure 5
Northern blot analysis. A) The map of pLD-5'UTR-ZZTEVIGF-1 shows a monocistron transcript of 1099 nt, a dicistron transcript of 2019 nt, and polyciston transcript of 4519 nt. B) Lane 1: untransformed control. Lanes 2–3: 5'UTRZZTEVIGF-1s transgenic lines (T0); Lanes 4–7: 5'UTRZZTEVIGF-1s transgenic lines (T1); Lanes 8–9 5'UTRZZTEVIGF-1n Protein quantification by ELISA in (T0); Lane 10: blank; Lane 11: IGF-1 probe used as a positive control.
Figure 6
Figure 6
Western Blot Analysis. The plant samples were run in 12% SDS-PAGE and the blot was detected using mouse anti-human IGF-1. Lane 1: 5'UTR-ZZTEV-IGF-1n transgenic line. Lane 3: T0 5'UTR-ZZTEV-IGF-1s transgenic lines. Lane 4: T1 5'UTR-ZZTEV-IGF-1s transgenic lines. Lanes 5–8: IGF-1 standards with a concentration of 10 ng, 25 ng, and 50 ng.
Figure 7
Figure 7
IGF-1 expression in transgenic chloroplasts. ELISAs show IGF-1 expression as percentage of the total soluble protein. A) Transgenic lines grown in a 16 hours light and 8 hours dark photoperiod; T0 are mature plants and T1 is a younger plant. B) Transgenic lines grown in continuous light for 13 days; C) Protein quantification by ELISA in young (Y), mature (M), and old (O) transgenic leaves. Young leaves were among the top few leaves; mature leaves were fully grown, present in the middle of the plant; the bottom few scenescing leaves were identified as old. D) Protein quantification by ELISA in seedlings and potted plants grown for 5 days and 15 days. E) IGF-1 expression in IGF-1s T0 and T1 transgenic lines. F) IGF-1s present in the total and soluble fractions of T1 and T0 generations.
Figure 8
Figure 8
Chloroplast derived IGF-1 before and following hydroxylamine treatment. Transgenic tobacco IGF-1 was purified from centrifuged plant homogenates by IgG-sepharose affinity column chromatography. Proteins eluted from the IgG-sepharose column were identified by polyacrylamide gel electrophoresis. Lanes from left to right: molecular weight marker proteins (MW), human insulin like growth factor 1 (human IGF-1), tobacco chloroplast-derived human IGF-1, (IGF-1A). Darker upper broad band of approx. 15 kDa = IGF-1 linked to Staphylococcus aureus Z domains. Partial removal of S. aureus Z domains by hydroxylamine cleavage (IGF-1B), lower broad band = IGF-1. Right lane = human insulin.
Figure 9
Figure 9
The IGF-1 proteins isolated from the IgG-sepharose column were separated on a 2-D focusing/phoresis acrylamide gel. Five μg of the IGF-1 – S. aureus fusion protein was loaded on a 10% bis-acrylamide gel for electrofocusing and phoresis. Electrofocusing was conducted initially over a pH range of 4–10. Following isoelectric focusing and electrophoresis, four proteins (6, 7, 14 and 25 kDa) were detected after Coomassie Blue staining. These proteins corresponded in molecular weight to ZZ-IGF-1 (A), Z-IGF-1 (B) and IGF-1 (C).
Figure 10
Figure 10
Mass Spectrometry Analysis of Chloroplast Synthesized Human IGF-1. The 7, 14 and 25 kDa protein bands were trypsin-digested and evaluated by mass spectrometry. The top panel is the pure MS without fragmentation. The second panel shows all of the significant MS/MS events derived from the MS scans. The third panel shows the MS/MS events that yielded a fragment with m/z 1421 +/- 1 mu. These were all grouped together in one cluster eluting at 55.32. S. aureus protein A was found in all spots examined and the active portion of IGF-1 was identified. In at least two of the spots analyzed, human IGF-1 and S. aureus Z-tag was detected. Shown are full MS and MS/MS patterns for discovery of peptide 105–116 with an elution time of 55.32 for a single charge mass of 1421.1 and a double charge mass of 711.6.
Figure 11
Figure 11
Chloroplast synthesized human IGF-1 stimulates the growth and proliferation of human cells in culture. Proliferation of human megakaryoblastic HU-3 cells were investigated by phase contrast light microscopy at 4 and 7 days after the addition of huIGF-1. Left panel: Four day HU-3 cell culture to which no chloroplast synthesized IGF-1 was added (400 × magnification). Right panel: HU-3 cell culture of the same age to which 62 ng/ml chloroplast-derived, partially purified IGF-1 was added at time zero (100 × magnification).
Figure 12
Figure 12
Effect of chloroplast-derived IGF-1 on HU-3 cell proliferation. IGF-1 was added to HU-3 cells; 48 hours later, cell proliferation was measured by the Cy-QUANT NF Cell proliferation assay (Invitrogen) and by hemocytometer counting. Proliferation was measured by fluorescence determination of DNA replication based on intercalation of a fluorescent dye into double stranded DNA. Cell proliferation was determined according to the instructions supplied by the manufacturer. Red (chloroplast derived IGF-1), blue (Sigma IGF-1), and green (negative control) lines represent the best fit of the respective data points for each proliferation assay treatment. Top row shows concentration (ng/ml) of IGF-1 (Sigma). Bottom numbers are dilution factor of chloroplast-derived IGF-1. Negative control is the dilution of the TS buffer.

Similar articles

Cited by

References

    1. Jones JH, Clemmons DR. Insulin like growth factors and their binding proteins: biological functions. Endocr Rev. 1995;16:3–10. - PubMed
    1. Feld S, Hirschberg R. Growth hormone, the insulin-like growth factor system, and the kidney. Endocr Rev. 1996;17:423–480. - PubMed
    1. Walsh G. Biopharmaceuticals: biochemistry and biotechnology. 1. John Wiley and Sons, England; 1998. pp. 235–243.
    1. Kim S, Lee Y. High-level expression and simple purification of recombinant human insulin-like growth factor I. J Biotechnol. 1996;48:97–105. - PubMed
    1. Blomsma MC, de Knegt RJ, Dullaart RP, Jansen PL. Insulin-like growth factor- I in liver cirrhosis. J Hepatology. 1997;27:1133–38. - PubMed

Publication types

MeSH terms

Substances

LinkOut - more resources