. 2009 Jan-Feb;8(1):45-54.

Near-infrared imaging of injured tissue in living subjects using IR-820

Affiliations

Near-infrared imaging of injured tissue in living subjects using IR-820

Suresh I Prajapati et al. Mol Imaging. 2009 Jan-Feb.

Abstract

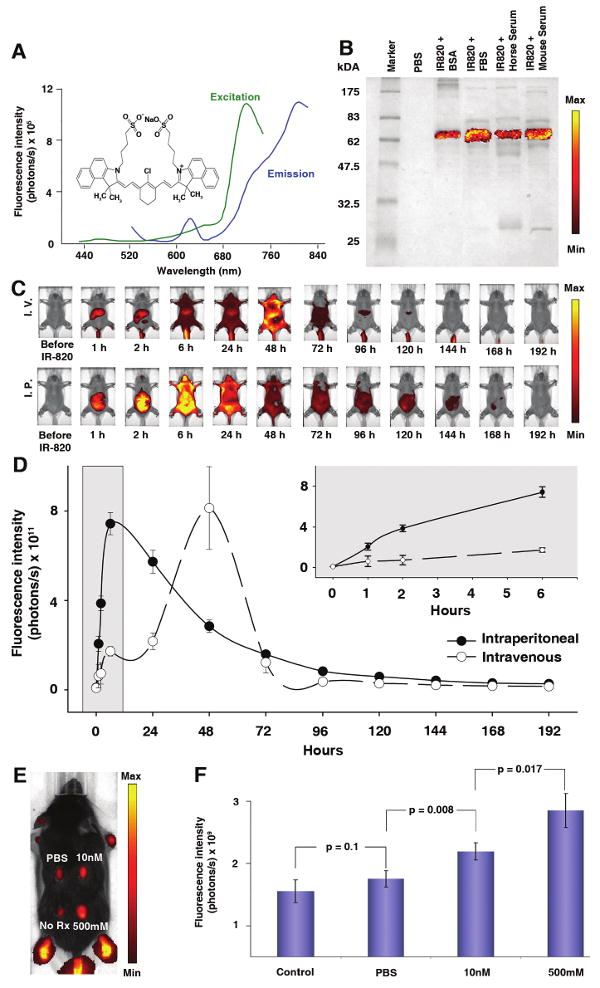
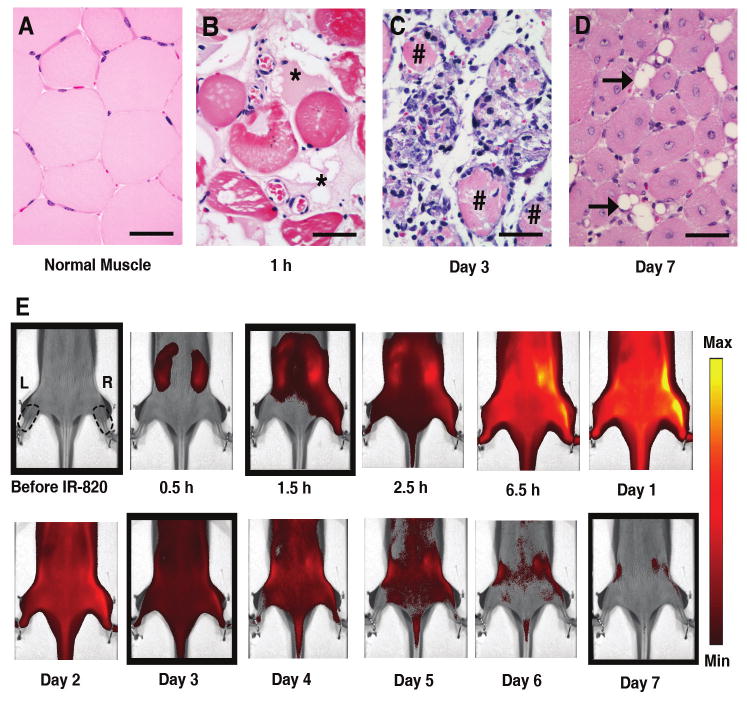
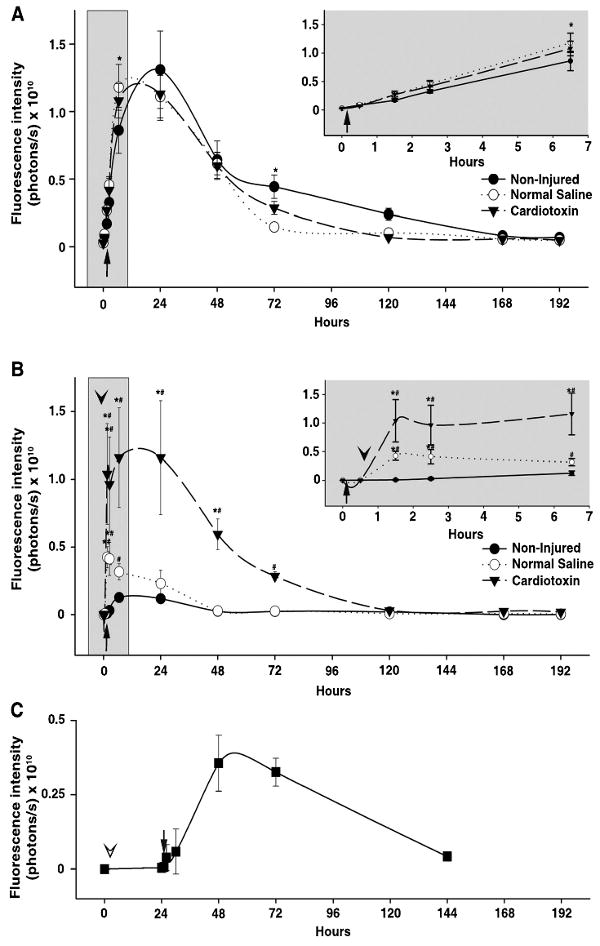
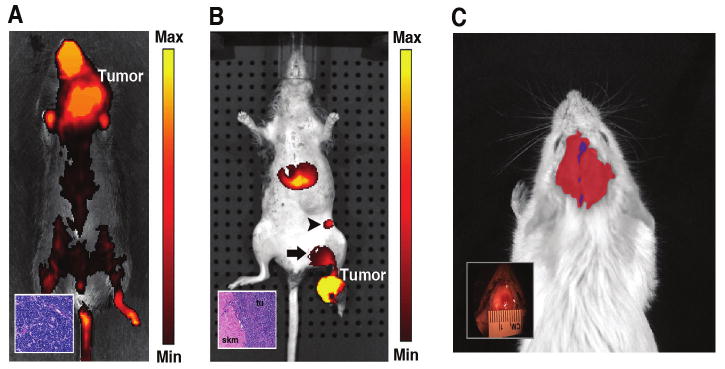
The unprecedented increase in preclinical studies necessitates high-throughput, inexpensive, and straightforward methods for evaluating diseased tissues. Near-infrared imaging of live subjects is a versatile, cost-effective technology that can be effectively used in a variety of pathologic conditions. We have characterized an inexpensive optoelectronic chemical, IR-820, as an infrared blood pool contrast agent to detect and quantify diseased tissue in live animals. IR-820 has maximal excitation and emission wavelengths of 710 and 820 nm, respectively. IR-820 emission is significantly improved in vivo on serum binding to albumin, and elimination occurs predominantly via the gastrointestinal tract. We demonstrate the utility of this contrast agent for serially imaging of traumatized tissue (muscle), tissue following reperfusion (eg, stroke), and tumors. IR-820 can also be employed to map regional lymph nodes. This novel contrast agent is anticipated to be a useful and an inexpensive tool for screening a wide variety of preclinical models of human diseases.


Conflict of interest statement

COMPETING INTERESTS STATEMENT

Use of IR-820 as a preclinical/clinical contrast agent is under intellectual property evaluation by UTHSCSA.

Figures

Figure 1
Figure 1
IR-820 is a commercially available optoelectronic chemical with promising applications in biological (preclinical) optical imaging. (A) Spectra for free IR-820 reveal excitation and emission peaks at 710 nm and 820 nm respectively. Inset shows the molecular structure of IR-820. (B) IR-820 and protein interaction visualized using 10% SDS PAGE stained with Coomassie Blue shows fluorescence signal in all serum samples at a size similar to bovine serum albumin. The scale bar ranges from 1 × 10⁶ to 1 × 10⁷ photons/s/cm2/steradian. (C) Whole body pharmacokinetics of IR-820 in hairless mice. Mice injected with 100 μl of IR-820 contrast agent intravenously through tail vein (top set) and intraperitoneal injection (bottom set). For both sets, first image prior to injection of IR-820, time thereafter in reference to IR-820 injection. The images are displayed with a minimum – maximum scale of 4 × 10⁸ to 4 × 10⁹ photons/s/cm2/steradian. (D) The animals were serially imaged for 8 days with considerable decrease in signal at 3 days after injection. Error bars, s.d.; n=4 mice/group. (E) Vascular permeability in a dose-dependent manner was increased by intradermal injection of histamine (0, 10 nM or 500 mM, each in a volume of 50 μl) in PBS. The left caudal thorax received no injection. IR-820 was injected intravenously and imaging was performed in triplicate on a single mouse 30 minutes after histamine injection. The image is adjusted at a minimum – maximum scale of 4 × 10⁹ to 4 × 10¹⁰ photons/s/cm2/steradian. (F) Quantitative fluorescence signal of Figure 1E shows an increase in signal from the histamine injected sites due to vasodilation of the tissues. Error bars, s.d.
Figure 2
Figure 2
Histology of cardiotoxin-induced injury and kinetics of IR-820 distribution. Representative microscopic appearance of normal (A) and injured muscle obtained at 1 hour (B) 3 days (C) or 7 days (D) following cardiotoxin treatment; * shows location of acellular protein; # demonstrates location of necrotic myofiber; horizontal arrow points to adipocyte; scale bar, 50 μm, hematoxylin and eosin. (E) HairlessSKH1/SKH1 mouse serial images after injury on right (R) hind limb with intramuscular cardiotoxin injection and no injection on the left (L) hind limb. The images are displayed with a minimum – maximum scale of 4 × 10⁸ to 4 × 10⁹ photons/s/cm2/steradian. Right and left regions of interest are shown as dotted lines. First image prior to intraperitoneal injection of IR-820, time thereafter in reference to IR-820 injection, cardiotoxin injected 0.5 hour after IR-820 injection. The boxed images correspond to the histology pictures in Figure 2A-D from left to right.
Figure 3
Figure 3
Kinetics of IR-820 in normal and injured lower limb muscle tissue of HairlessSKH1/SKH1 mice. (A) The signal intensity plot of non-injected, left hind limbs. Inset graph demonstrates an expanded view of the early time points immediately following IR-820 injection. * denotes p≤0.03 in pairwise comparison between normal saline or cardiotoxin groups compared to the Non-injured group. Error bars, s.d.; n=3-4 mice/group. (B) Paired difference of injected hind limb and non-injected hind limb, time on x-axis measured after IR-820 injection (arrow); cardiotoxin or normal saline injection into the right hind limb denoted by the arrowhead. Inset graph demonstrates an expanded view of the early time points immediately following IR-820 and cardiotoxin or normal saline injection. * denotes p≤0.01 in pairwise comparison between groups. # denotes p≤0.03 for each time point within each group compared to baseline, defined as 0.5 hours after IR-820 injection and prior to cardiotoxin or normal saline injection. Error bars, s.d.; n=3-4 mice/group. (C) Ongoing vascular leak demonstrated by the paired difference of cardiotoxin (right) and normal saline (left) injected hind limbs (arrowhead) followed by intraperitoneal IR-820 injection (arrow) 24 hours later. Time on x-axis measured after cardiotoxin and normal saline injections. Error bars, s.d.; n=2 mice/group.
Figure 4
Figure 4
In vivo imaging of diseased animals using IR-820. (A) A mouse bearing a neck tumor was imaged 15 minutes after injection of 100 μl of IR-820 intravenously through tail vein injection. A large portion (28.4% of total) of the IR-820 fluorescence was concentrated in the viable solid tumor region. The inset shows the histology which was consistent with lymphoma. The image has been displayed at a minimum – maximum scale of 3 × 10⁸ to 2 × 10⁹ photons/s/cm2/steradian. (B) 100 μl of IR-820 was administered directly into the foot tumor of a transgenic Myf6 ICNm/WT Pax3 P3Fm/P3Fm Trp53 F2-10/WT Rb1 Flox/Flox mouse and imaged 24 hours after injection. Fluorescence signal is present at the tumor site as well as popliteal (arrow) and inguinal (arrow head) lymph nodes. Histology demonstrates rhabdomyosarcoma tumor cells adjacent to normal skeletal muscle (inset). tu stands for tumor, skm stands for skeletal muscle. The image is thresholded at a minimum – maximum scale of 5 × 10⁸ to 1 × 10⁹ photons/s/cm2/steradian. (C) IR-820 contrast agent was given via tail vein injection into a mouse after induction of a thrombotic stroke. Blue region shows the site of the stroke and red region shows the swelling in the area of tissue injury caused by the stroke. The inset shows the gross picture of mouse with stoke. A minimum – maximum scale of 8 × 10⁸ to 6 × 10⁹ photons/s/cm2/steradian has been used to display the image.

References

    1. Sevick-Muraca EM, Houston JP, Gurfinkel M. Fluorescence-enhanced, near infrared diagnostic imaging with contrast agents. Curr Opin Chem Biol. 2002;6:642–50. - PubMed
    1. Nomoto H, Shiraga F, Yamaji H, et al. Evaluation of radial optic neurotomy for central retinal vein occlusion by indocyanine green videoangiography and image analysis. Am J Ophthalmol. 2004;138:612–9. - PubMed
    1. Hori T, Yagi S, Iida T, et al. Stability of cirrhotic systemic hemodynamics ensures sufficient splanchnic blood flow after living-donor liver transplantation in adult recipients with liver cirrhosis. World J Gastroenterol. 2007;13:5918–25. - PMC - PubMed
    1. Cao Y, Pan C, Balter JM, et al. Liver function after irradiation based on computed tomographic portal vein perfusion imaging. Int J Radiat Oncol Biol Phys. 2008;70:154–60. - PMC - PubMed
    1. Nahrendorf M, Sosnovik DE, Waterman P, et al. Dual channel optical tomographic imaging of leukocyte recruitment and protease activity in the healing myocardial infarct. Circ Res. 2007;100:1218–25. - PubMed

Publication types

MeSH terms

LinkOut - more resources