. 2009 Jun;30(17):3110-7.
doi: 10.1016/j.biomaterials.2009.03.017. Epub 2009 Apr 3.

On-line observation of cell growth in a three-dimensional matrix on surface-modified microelectrode arrays

Affiliations

On-line observation of cell growth in a three-dimensional matrix on surface-modified microelectrode arrays

Shu-Ping Lin et al. Biomaterials. 2009 Jun.

Abstract

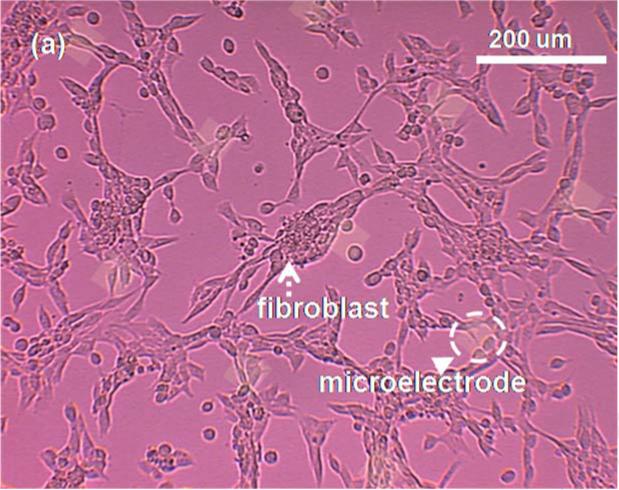
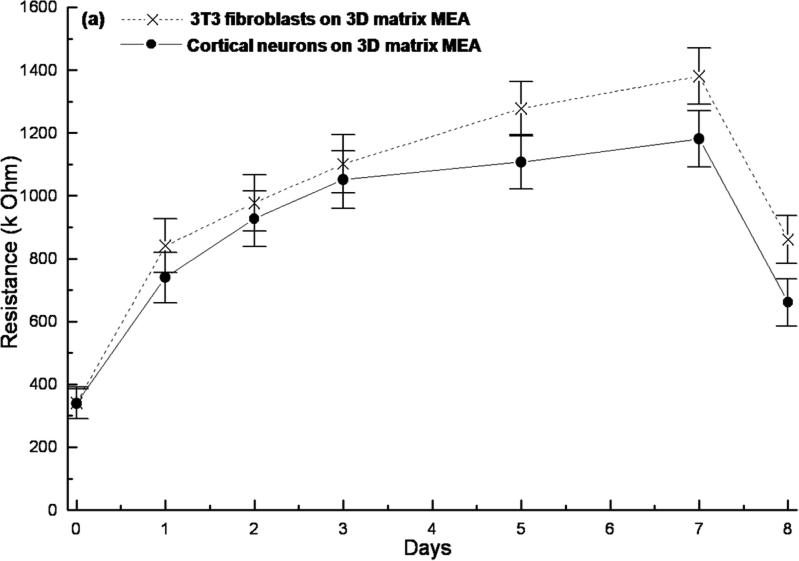
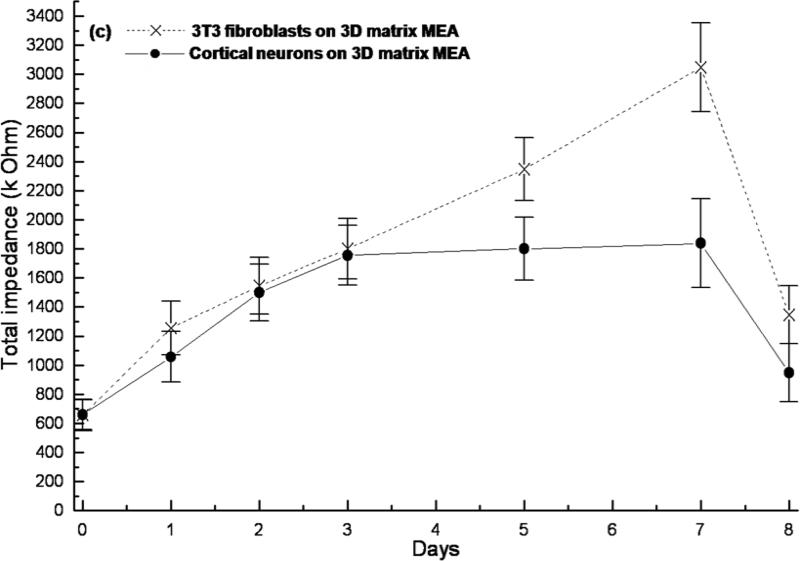
Despite many successful applications of microelectrode arrays (MEAs), typical two-dimensional in-vitro cultures do not project the full scale of the cell growth environment in the three-dimensional (3D) in-vivo setting. This study aims to on-line monitor in-vitro cell growth in a 3D matrix on the surface-modified MEAs with a dynamic perfusion culture system. A 3D matrix consisting of poly(ethylene glycol) hydrogel supplemented with poly-D-lysine was subsequently synthesized in situ on the self-assembled monolayer modified MEAs. FTIR spectrum analysis revealed a peak at 2100 cm(-1) due to the degradation of the structure of the 3D matrix. After 2 wks, microscopic examination revealed that the non-degraded area was around 1500 microm(2) and provided enough space for cell growth. Fluorescence microscopy revealed that the degraded 3D matrix was non-cytotoxic allowing the growth of NIH3T3 fibroblasts and cortical neurons in vitro. Time-course changes of total impedance including resistance and reactance were recorded for 8 days to evaluate the cell growth in the 3D matrix on the MEA. A consistent trend reflecting changes of reactance and total impedance was observed. These in-vitro assays demonstrate that our 3D matrix can construct a biomimetic system for cell growth and analysis of cell surface interactions.


Figures

Fig. 1
Fig. 1
Schematic diagram of the experimental setup of impedance recording and perfusion culture system. Cells and 3D matrix were in custom-made vertically-oriented fluid reservoir with a seal cap on the top of the MEA. A peristaltic pump was used to circulate culture medium in perfusion culture system with flow rate of 1 μl/min.
Fig.2
Fig.2
Characterization of 3D matrix degradation. 3D matrices on the SAMs-surface-modified MEAs were characterized for degradation in PBS for a 4 wk period. (a) The degradation rate of 3D matrix and release of eosin Y from degraded 3D matrix were measured. (b) The specific chemical bonds of 3D matrix before and after culture were analyzed and marked in FTIR scanning. (c) The degraded area and swelling test of 3D matrix were evaluated from 3D matrix incubated in PBS. Error bars represent mean ± SEM (n=20). The inset in (c) is a SEM image of a representative profile of degraded area which was taken at 1 wk of culture.
Fig.2
Fig.2
Characterization of 3D matrix degradation. 3D matrices on the SAMs-surface-modified MEAs were characterized for degradation in PBS for a 4 wk period. (a) The degradation rate of 3D matrix and release of eosin Y from degraded 3D matrix were measured. (b) The specific chemical bonds of 3D matrix before and after culture were analyzed and marked in FTIR scanning. (c) The degraded area and swelling test of 3D matrix were evaluated from 3D matrix incubated in PBS. Error bars represent mean ± SEM (n=20). The inset in (c) is a SEM image of a representative profile of degraded area which was taken at 1 wk of culture.
Fig. 3
Fig. 3
Assessment of cell growth of fibroblasts and cortical neurons in conventional dish and 3D matrix MEA. Fibroblasts and neurons were placed on culture dish as control. Fibroblasts and neurons were respectively mixed with hydrogel-precursor solution to form a 3D matrix on surface-modified MEAs for observing the cell growth, which was monitored for 7 d. (*, p < 0.05; **, p < 0.01; ***, p < 0.001). Error bars represent mean ± SEM (n=20).
Fig. 4
Fig. 4
Optical microscopic images and fluorescent images of cells after 5 d on 3D matrix MEA. Representative images of NIH3T3 fibroblasts (a) and cortical neurons (b) are shown. Arrows point individual cells and arrowheads with a dash circle point microelectrodes in 3D matrix MEA. Fluorescent image of fibroblasts stained with DAPI (blue) and rhodamine-phalloidin (red) is shown in (c). Neurons were visualized with primary anti-NeuN antibody (green) and DAPI (blue) as shown in (d).
Fig. 4
Fig. 4
Optical microscopic images and fluorescent images of cells after 5 d on 3D matrix MEA. Representative images of NIH3T3 fibroblasts (a) and cortical neurons (b) are shown. Arrows point individual cells and arrowheads with a dash circle point microelectrodes in 3D matrix MEA. Fluorescent image of fibroblasts stained with DAPI (blue) and rhodamine-phalloidin (red) is shown in (c). Neurons were visualized with primary anti-NeuN antibody (green) and DAPI (blue) as shown in (d).
Fig. 5
Fig. 5
Time-course of impedance recordings. (a) resistance, (b) reactance, and (c) total impedance for NIH3T3 fibroblasts and cortical neurons on 3D matrix MEA were measured for 8 d.
Fig. 5
Fig. 5
Time-course of impedance recordings. (a) resistance, (b) reactance, and (c) total impedance for NIH3T3 fibroblasts and cortical neurons on 3D matrix MEA were measured for 8 d.
Fig. 5
Fig. 5
Time-course of impedance recordings. (a) resistance, (b) reactance, and (c) total impedance for NIH3T3 fibroblasts and cortical neurons on 3D matrix MEA were measured for 8 d.
Fig. 6
Fig. 6
Schematic diagrams of impedance models for cells growing on surface-modified MEA (a) and cells growing on 3D matrix surface-modified MEA (b).

References

    1. Buitenweg JR, Rutten WLC, Marani E, Polman SKL, Ursum J. Extracellular detection of active membrane currents in the neuron-electrode interface. J Neurosci Meth. 2002;115(2):211–221. - PubMed
    1. Chiappalone M, Vato A, Tedesco MB, Marcoli M, Davide F, Martinoia S. Networks of neurons coupled to microelectrode arrays: a neuronal sensory system for pharmacological applications. Biosens Bioelectron. 2003;18(5-6):627–634. - PubMed
    1. Jackson A, Mavoori J, Fetz EE. Long-term motor cortex plasticity induced by an electronic neural implant. Nature. 2006;444(7115):56–60. - PubMed
    1. Keefer EW, Gramowski A, Stenger DA, Pancrazio JJ, Gross GW. Characterization of acute neurotoxic effects of trimethylolpropane phosphate via neuronal network biosensors. Biosens Bioelectron. 2001;16(7-8):513–525. - PubMed
    1. Ingebrandt S, Yeung CK, Krause M, Offenhausser A. Cardiomyocyte-transistor-hybrids for sensor application. Biosens Bioelectron. 2001;16(7-8):565–570. - PubMed

Publication types

MeSH terms