. 2009 Apr 17;30(4):493-507.
doi: 10.1016/j.immuni.2009.01.014. Epub 2009 Apr 2.

Genome-wide lineage-specific transcriptional networks underscore Ikaros-dependent lymphoid priming in hematopoietic stem cells

Affiliations

Genome-wide lineage-specific transcriptional networks underscore Ikaros-dependent lymphoid priming in hematopoietic stem cells

Samuel Yao-Ming Ng et al. Immunity. .

Abstract

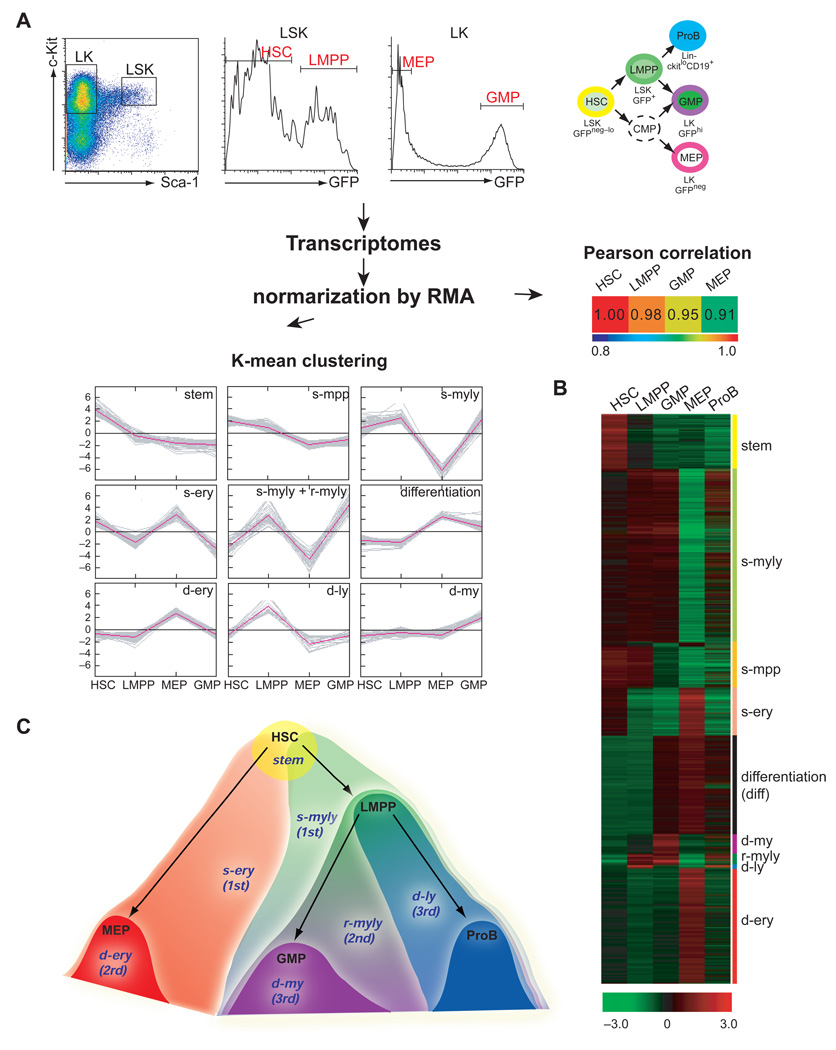
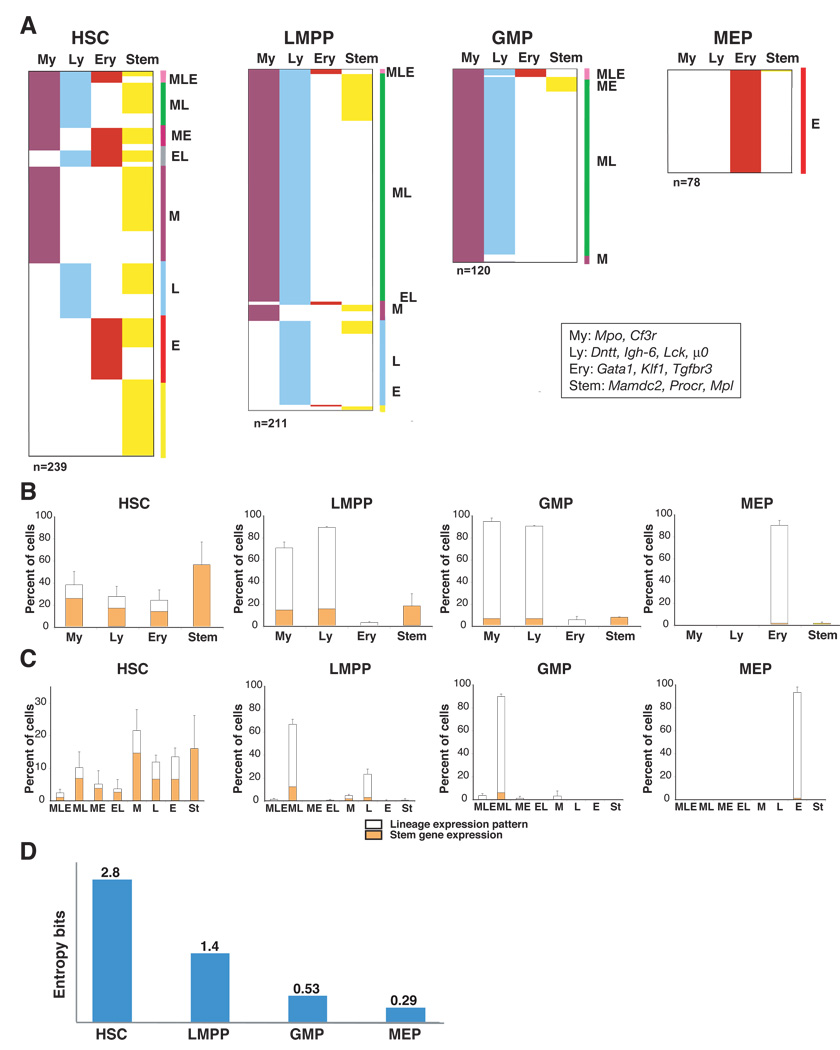
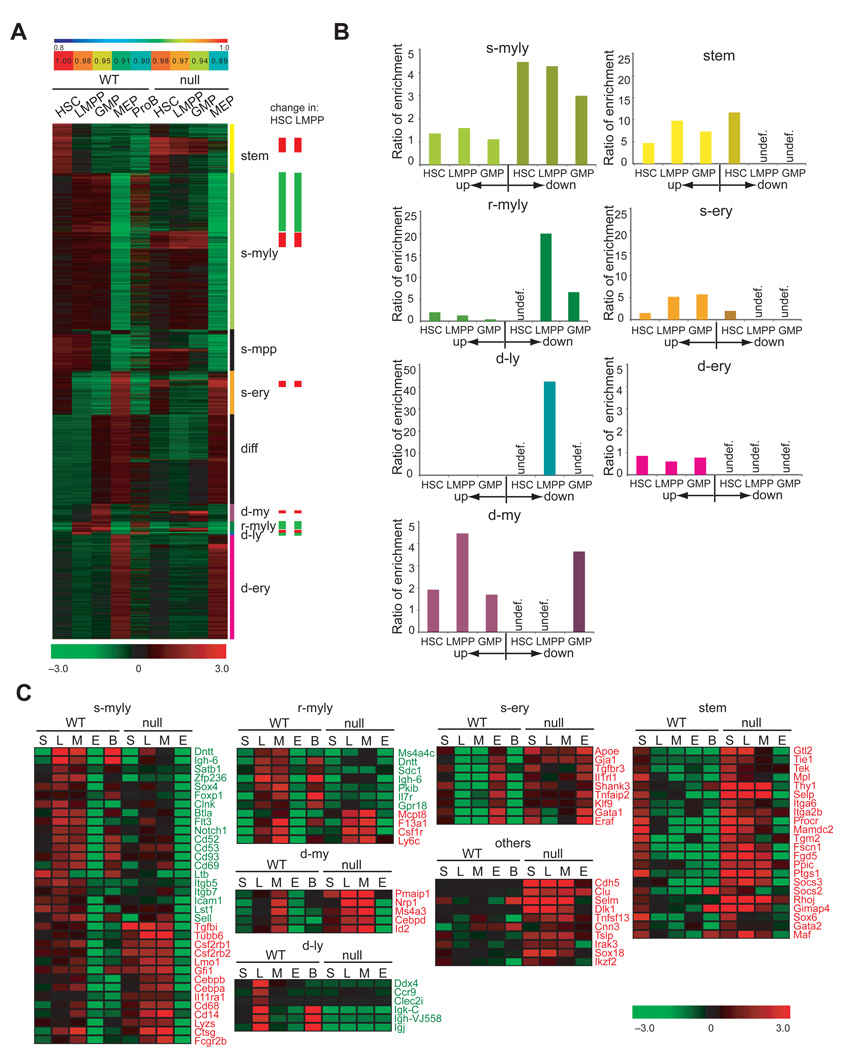
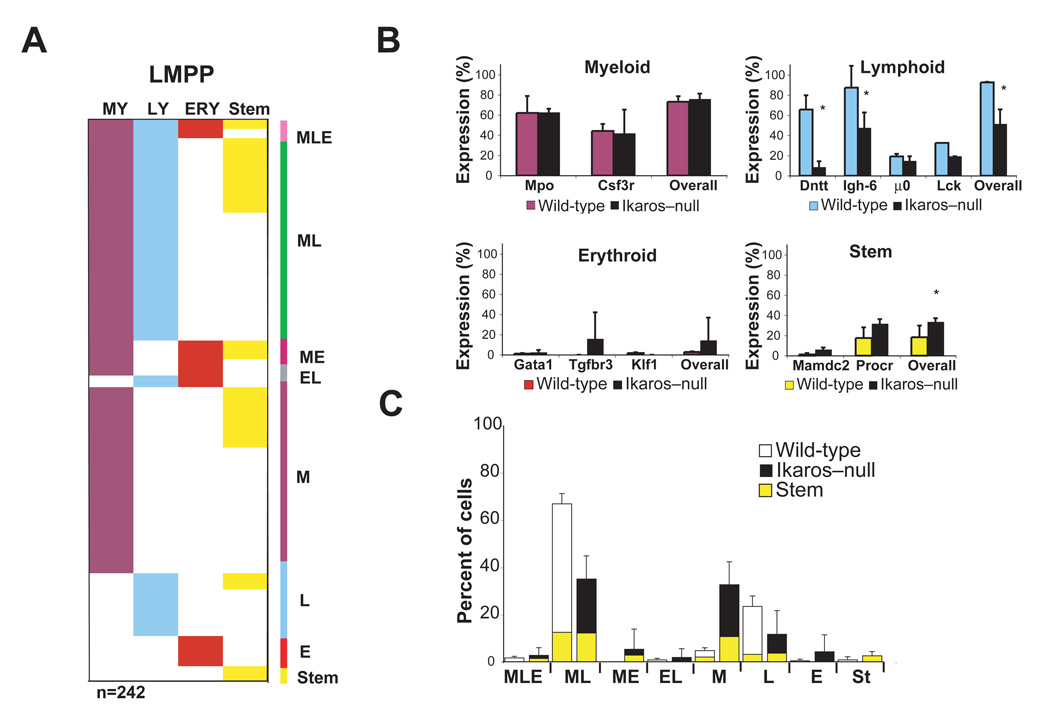
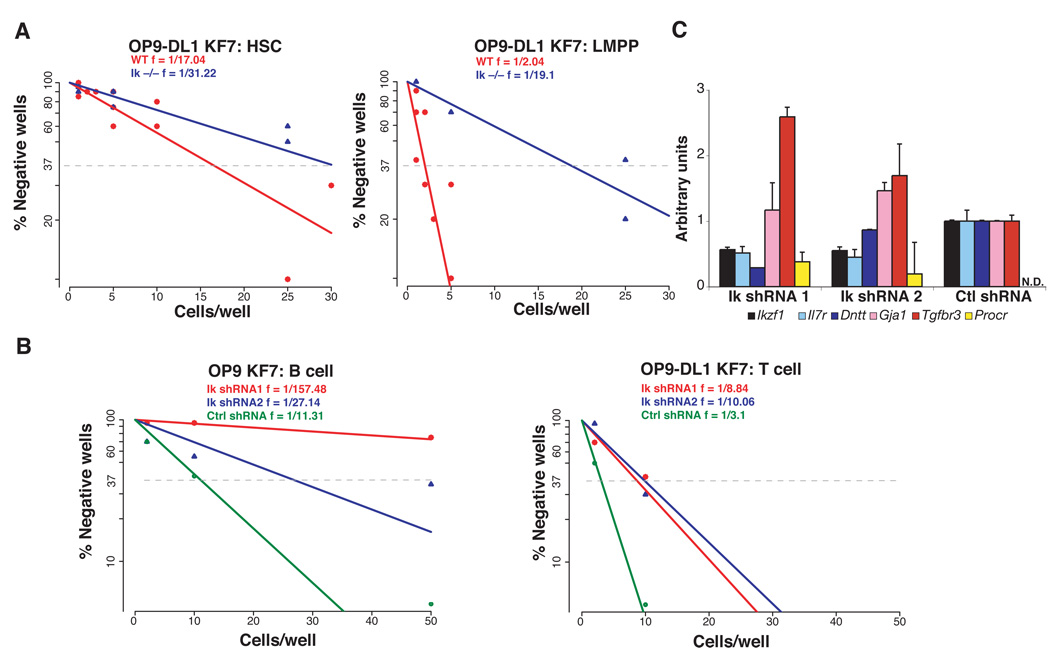
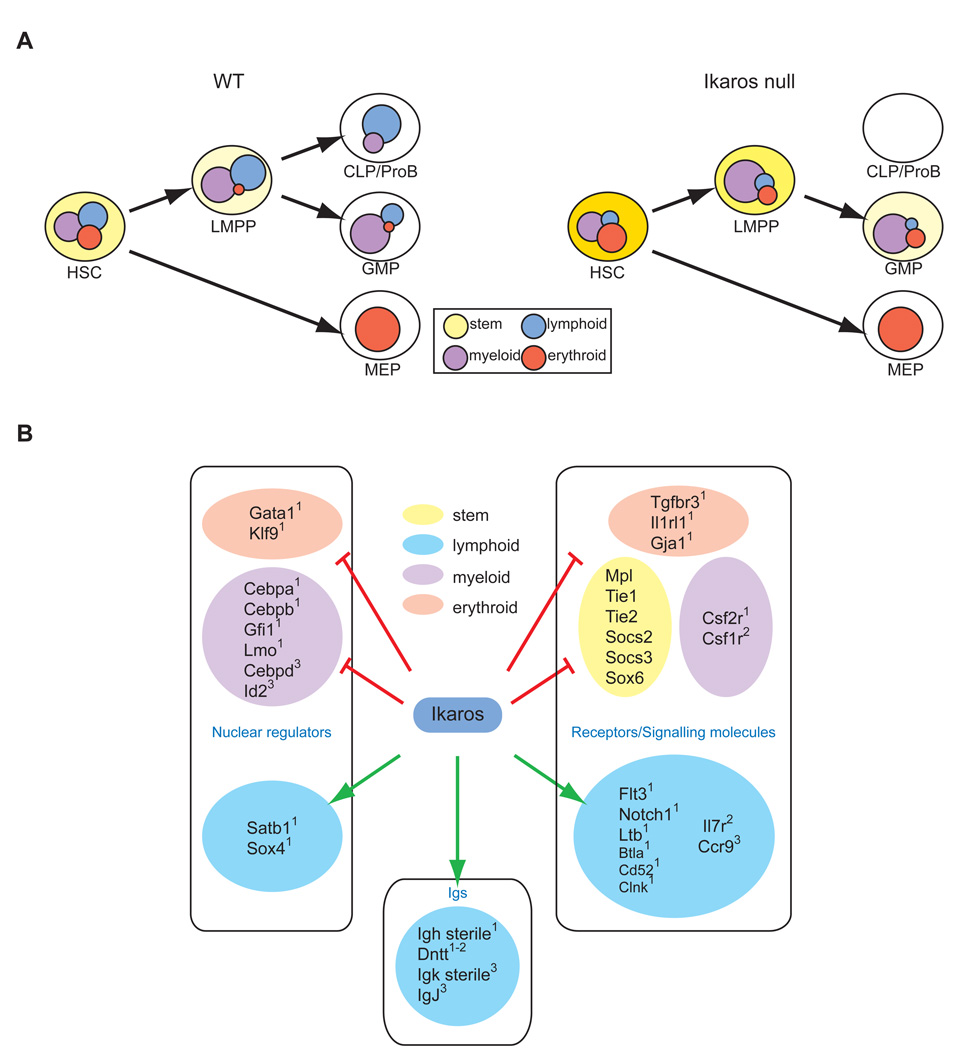
The mechanisms regulating lineage potential during early hematopoiesis were investigated. First, a cascade of lineage-affiliated gene expression signatures, primed in hematopoietic stem cells (HSCs) and differentially propagated in lineage-restricted progenitors, was identified. Lymphoid transcripts were primed as early as the HSC, together with myeloid and erythroid transcripts. Although this multilineage priming was resolved upon subsequent lineage restrictions, an unexpected cosegregation of lymphoid and myeloid gene expression and potential past a nominal myeloid restriction point was identified. Finally, we demonstrated that whereas the zinc finger DNA-binding factor Ikaros was required for induction of lymphoid lineage priming in the HSC, it was also necessary for repression of genetic programs compatible with self-renewal and multipotency downstream of the HSC. Taken together, our studies provide new insight into the priming and restriction of lineage potentials during early hematopoiesis and identify Ikaros as a key bivalent regulator of this process.


Figures

Figure 1
Figure 1. A cascade of lineage-specific transcriptional signatures primed in the HSC and propagated into appropriate lineage-restricted progeny
(A) An Ikaros-GFP reporter that displays a bimodal distribution in the LSK and LK compartments (Yoshida et al., 2006), was used to isolate HSC-enriched (~80% LT-+ST-HSC and ~20% MPP; LSK GFPneg-lo as in Figure S1B), LMPP (LSK GFP+), MEP (LK GFPneg) and GMP (LK GFPhi) populations for global gene profiling. The developmental relationship between progenitors used for this study is indicated. Progenitor expression profiles were subjected to Pearson correlation coefficient analysis and K means clustering that deduced nine differentially expressed signatures (Table 1). (B) Heat map of signature expression in HSC, LMPP, MEP, GMP and ProB. Signature designation and lineage affiliation is provided on the right. (C) A graphic representation of signature distribution at the early steps of the hematopoietic hierarchy.
Figure 2
Figure 2. Multiplex single cell expression analysis of lineage-affiliated transcripts in HSC and progeny
A. Single cells from HSC, LMPP, GMP and MEP populations were sorted into 96 well plates and subjected to reverse transcription followed by a two-step nested PCR for Actb and lineage-affiliated transcripts (My; Mpo, Csf3r, Ly; Dntt, Igh-6, Lck and µ0, Ery; Gata1, Klf1, Tgfbr3 and Stem; Mpl, Mamdc2 and Procr). Progenitors expressing at least one lineage-specific transcript are color-coded appropriately in each panel. Co-expressed patterns of lineage transcripts are identified on the right side of each panel. The total number of cells used in 2–4 experiments is indicated below each panel. Cells were provided from two or more independent sorts. The percentage of overall lineage-affiliated transcript distribution (B) and the percentage of co-expression of lineage- affiliated transcripts (C), are provided for cells in each progenitor population. The % of progenitors that express HSC-affiliated genes is shown for both the whole population and for subsets primed with lineage-specific genes. Mean +/− SD on percent distribution for progenitor experiments is shown. (D) The single progenitor expression data was analyzed by information theory (Shannon entropy) to provide an independent measure of the differentiation uncertainty (entropy value in bits) of each subset.
Figure 3
Figure 3. Latent lymphoid potential in the GMP
(A) Limiting dilution analysis of GMP and LMPP for T cell, B cell and myeloid differentiation potential. Cells were sorted at the indicated doses and co-cultured with OP9-DL1 for 14–18 days and with OP9 for 8–11 days under conditions that promote T cell, B cell and myeloid differentiation before FACS analysis for lineage markers. Frequencies of T cell, B cell differentiation were calculated using Pöisson statistics. Analysis of combined data from four independent experiments is shown. R2 values are provided for each progenitor analysis. (B) 2000 LMPP (white circle), 7,500 GMP (a-grey diamond) or 30,000 GMP (b-black diamond,) were intravenously injected into sublethally irradiated recipient mice. Total and lineage- specific (Mac-1+, B220+, Thy1.2+) donor contribution (GFP+) was measured at days 5, 7, 13 and 22 post-injection. For every time point 2–4 mice per group were analyzed. (C) Representative LMPP and GMP donor contributions in the myeloid and B cell lineage (Mac-1+ vs. B220+) in the bone marrow at day 7 post-transplantation. LMPP and GMP contributions (GFP+Thy1.2+) to CD4 vs. CD8 profiles in the thymus is also shown at day 13 post-transplantation.
Figure 4
Figure 4. Ikaros effects on lineage-specific signatures during early hematopoiesis
(A) Graphical representation of Pearson correlation coefficient analysis and heat map of signature expression in Ikaros-null vs. wild type progenitors. Signature designation and Ikaros effects (down-green, up-red) are indicated on the right. (B) Ratio of enrichment of gene signature sets with respect to Ikaros-differentially regulated gene lists in mutant HSC, LMPP and GMP as calculated by ratio-of-ratios method. Down-regulation of signature sets is not shown for progenitors where they are normally not expressed (undef). (C) Effects of Ikaros deletion on select members of the stem, s-myly, s-ery, r-myly, d-my and d-ly signatures. Genes exhibiting down-regulation (green) and up-regulation (red) are shown. A heat map of the average expression level (base2 log transformed mean centered; −3.0 to + 3.0) deduced from three independent samples is shown.
Figure 5
Figure 5. Multiplex single-cell gene expression analysis of Ikaros–null LMPP
(A) Single progenitor analysis for lineage-affiliated transcripts was performed as described in Figure 2. Mutant LMPP (n=242) generated from two independent sorts are shown. (B) The percentage of overall lineage transcript distribution as well as of individual lineage-affiliated transcripts is provided for WT and mutant populations. *p<0.05. (C) A comparison of lineage co-expression patterns between WT and KO LMPP is provided. HSC-affiliated gene expression manifested within each co-expression pattern is shown. Mean +/− SD on percent distribution for the experiments performed per progenitor population is indicated.
Figure 6
Figure 6. Ikaros is required for priming, augmentation and maintenance of lymphoid potential
(A) T cell differentiation potential of HSC and LMPP from WT and Ikaros-null mice as revealed by limiting dilution analysis. Cells were sorted at the indicated doses and co-cultured with OP9-DL1 for 14–21 days under lymphoid conditions before analyzed for expression of lineage-specific differentiation markers. Frequencies of T cell differentiation were calculated using linear regression analysis of data from five combined experiments (Table S2). R2 values are provided for each progenitor analysis. (B) The differentiation potential of LMPP transduced with lentivirus-expressing shRNAs against Ikzf1 (1 and 2) or control shRNA was determined. Transduced LMPP were cocultured with OP9 to test B and myeloid frequency and with OP9-DL1 to test T cell frequency. Frequencies of T and B cell differentiation were calculated using Pöisson statistics. Data from one of two representative experiments is shown (Table S3). (C) Real-time RT-PCR of lymphoid (Ikzf1, Dntt, IL7R), erythroid (Gja1, Tgfbr3) and stem (Procr) transcripts amplified from at least 5000 lentivirally-transduced LMPPs harvested 48 hours after lentiviral transduction. The data is representative of two independent experiments.
Figure 7
Figure 7. Regulation of multi-lineage transcriptional priming during early hematopoiesis
(A) Priming of myeloid (purple), erythroid (red) and lymphoid (blue) transcriptional programs occur at a similar frequency (~1/3) in the HSC. A similar low level of overlap between disparate genetic programs supports their stochastic co-priming at the multipotent state. Subsequent lineage restrictions are demarcated by an increase in lineage-appropriate transcription and decrease in lineage-inappropriate counterparts. Ikaros is a key regulator of this process. In the HSC compartment, Ikaros promotes priming and establishment of lymphoid genetic programs while in lympho-myeloid restricted progenitors it represses expression of lineage-inappropriate transcripts. Many of the genes repressed by Ikaros in the LMPP and GMP underscore a multipotent differentiation state. (B) Ikaros, as a bivalent regulator of a genetic network that controls lineage output in the HSC compartment. Select Ikaros-dependent components of this network that influence the myeloid (purple), lymphoid (blue), erythroid (pink) and stem cell (yellow) fate are shown. Superscripted numbers indicate placement of these factors in the cascade of lineage-specific and stem cell signatures described in Figure 1 and Table 1.

Comment in

Similar articles

Cited by

References

    1. Adolfsson J, Borge OJ, Bryder D, Theilgaard-Monch K, Astrand-Grundstrom I, Sitnicka E, Sasaki Y, Jacobsen SE. Upregulation of Flt3 expression within the bone marrow Lin(−)Sca1(+)c-kit(+) stem cell compartment is accompanied by loss of self-renewal capacity. Immunity. 2001;15:659–669. - PubMed
    1. Adolfsson J, Mansson R, Buza-Vidas N, Hultquist A, Liuba K, Jensen CT, Bryder D, Yang L, Borge OJ, Thoren LA, et al. Identification of Flt3+lympho-myeloid stem cells lacking erythro-megakaryocytic potential a revised road map for adult blood lineage commitment. Cell. 2005;121:295–306. - PubMed
    1. Akashi K, He X, Chen J, Iwasaki H, Niu C, Steenhard B, Zhang J, Haug J, Li L. Transcriptional accessibility for genes of multiple tissues and hematopoietic lineages is hierarchically controlled during early hematopoiesis. Blood. 2003;101:383–389. - PubMed
    1. Akashi K, Traver D, Miyamoto T, Weissman IL. A clonogenic common myeloid progenitor that gives rise to all myeloid lineages. Nature. 2000;404:193–197. - PubMed
    1. Allman D, Sambandam A, Kim S, Miller JP, Pagan A, Well D, Meraz A, Bhandoola A. Thymopoiesis independent of common lymphoid progenitors. Nat Immunol. 2003;4:168–174. - PubMed

Publication types

Substances

Associated data