. 2009 Apr 3;137(1):159-71.
doi: 10.1016/j.cell.2009.01.050.

The postsynaptic density proteins Homer and Shank form a polymeric network structure

Affiliations

The postsynaptic density proteins Homer and Shank form a polymeric network structure

Mariko Kato Hayashi et al. Cell. .

Abstract

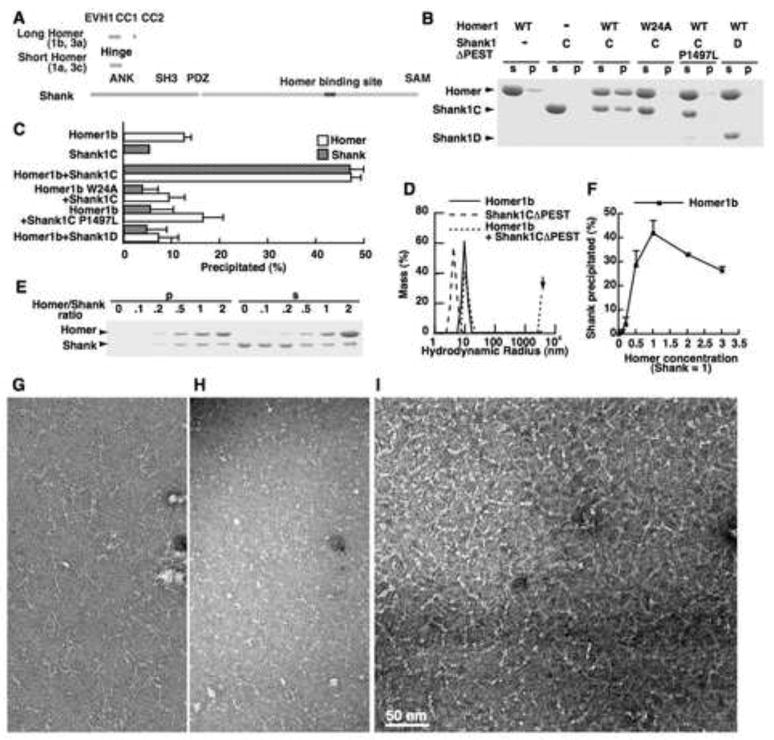
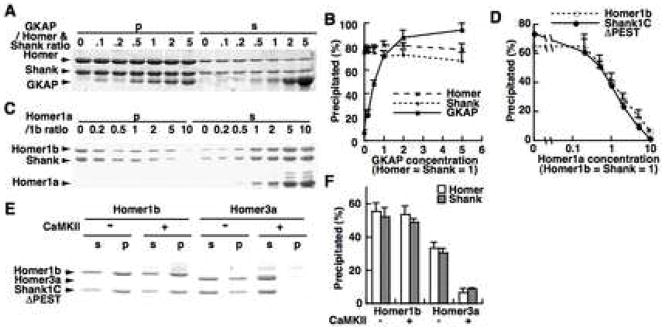
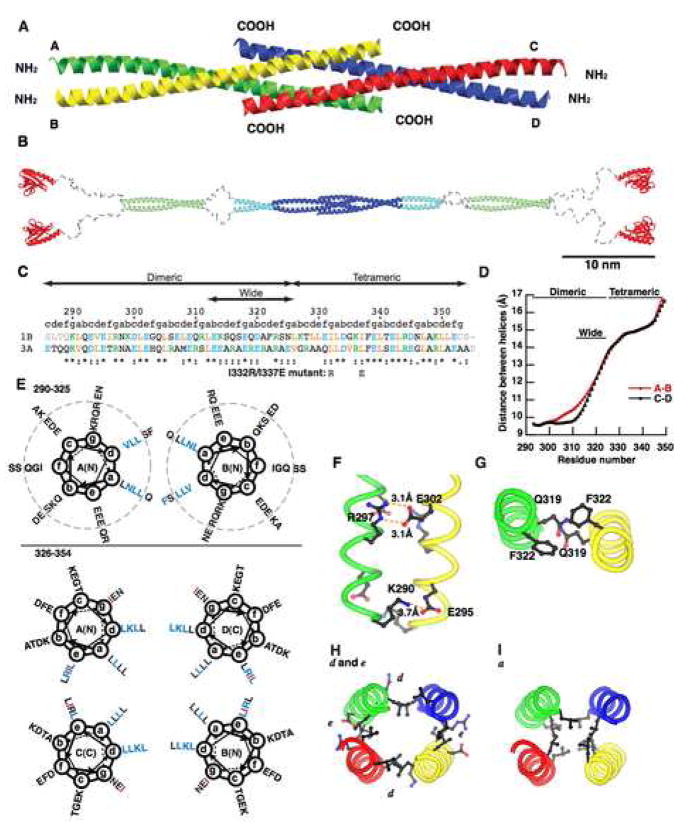
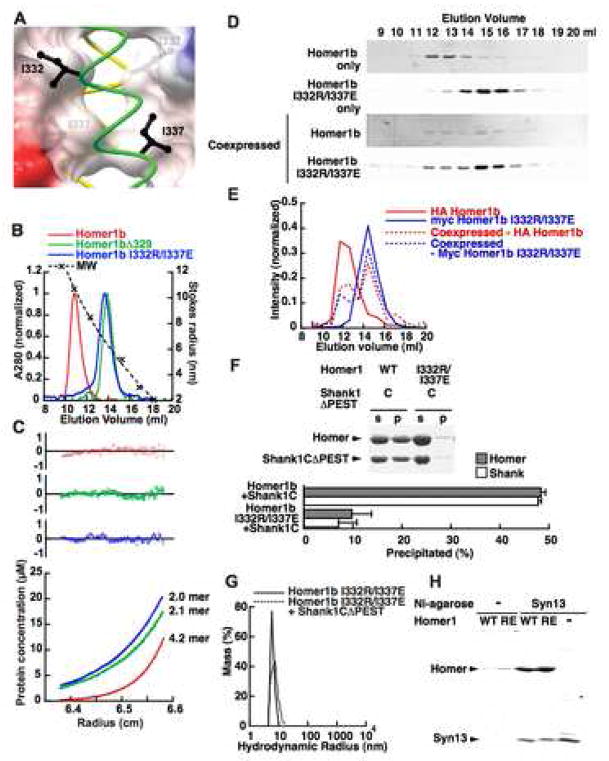
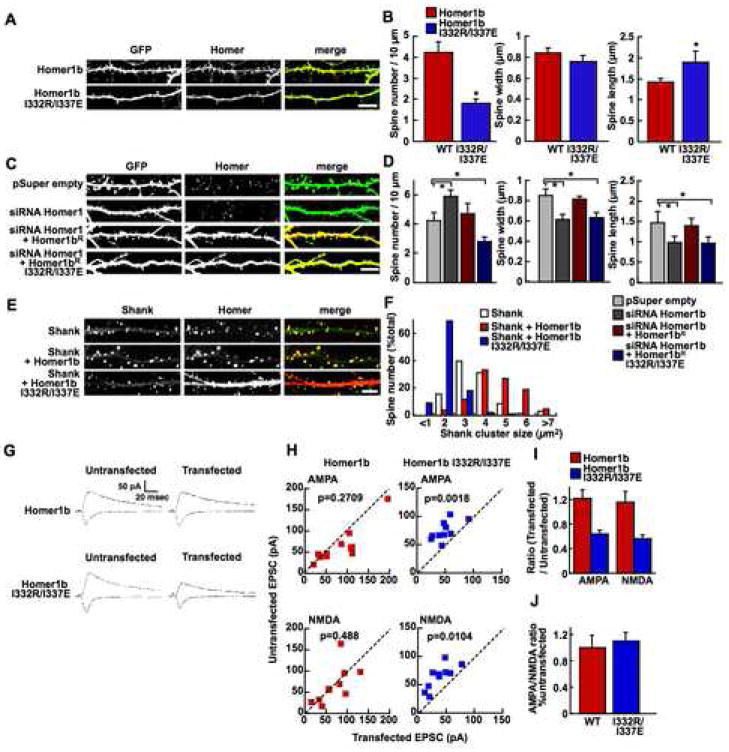
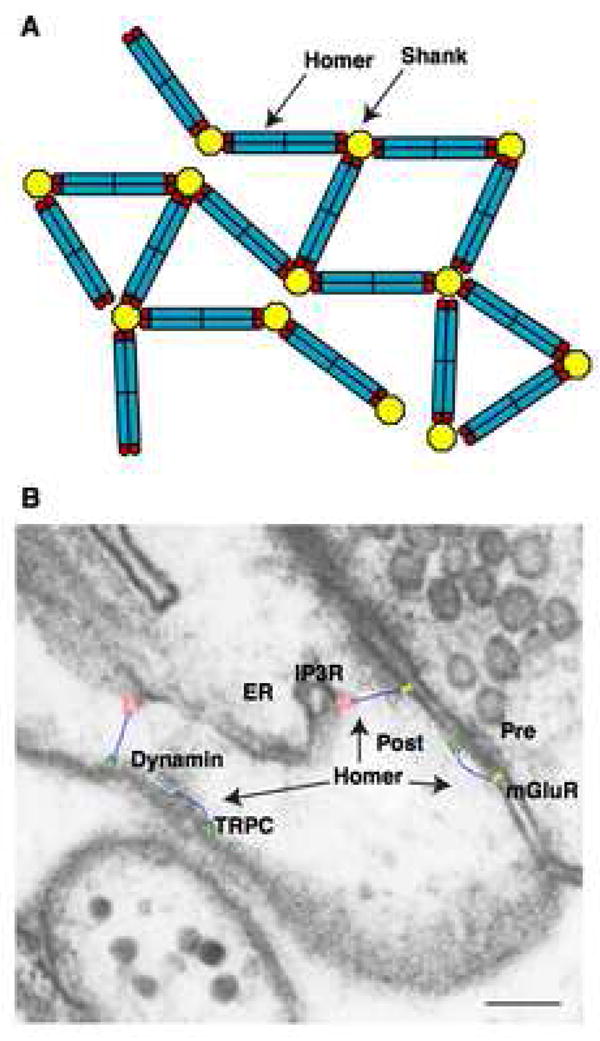
The postsynaptic density (PSD) is crucial for synaptic functions, but the molecular architecture retaining its structure and components remains elusive. Homer and Shank are among the most abundant scaffolding proteins in the PSD, working synergistically for maturation of dendritic spines. Here, we demonstrate that Homer and Shank, together, form a mesh-like matrix structure. Crystallographic analysis of this region revealed a pair of parallel dimeric coiled coils intercalated in a tail-to-tail fashion to form a tetramer, giving rise to the unique configuration of a pair of N-terminal EVH1 domains at each end of the coiled coil. In neurons, the tetramerization is required for structural integrity of the dendritic spines and recruitment of proteins to synapses. We propose that the Homer-Shank complex serves as a structural framework and as an assembly platform for other PSD proteins.


Figures

Figure 1
Figure 1. Formation of a high-order complex between Homer and Shank
(A) Domain structures of Homer and Shank. (B) Formation of a high-order complex between Homer1b and Shank1CΔPEST. Homer and Shank were mixed at a concentration of 19 μM each, and centrifuged after overnight incubation at 4 °C. The pellets (p) and the supernatants (s) in the same volume were separated by SDS-PAGE and stained by Coomassie. Shank1CΔPEST (C) is a construct with the PDZ domain, the Homer binding site, and a SAM domain. Shank1DΔPEST (D) is a construct with the PDZ domain and the Homer binding site. (C) A summary of four repeated experiments similar to (B). Error bars show standard errors. (D) Hydrodynamic radius distribution measured by dynamic light scattering of Shank, Homer, and a mixture of the two. The “arrow” indicates a high-order complex. Note that because this peak is at the upper limit of measurement, at 3.6 μm, the reading of Mass (%) estimated as globular proteins could be inaccurate. (E) The stoichiometry of the complex between Homer1b and ShankC1ΔPEST. Increasing concentrations (0–19 μM) of Homer1b were added to a fixed concentration of Shank (9.6 μM). (F) The summary of the amount of Shank precipitate in three repeated experiments similar to (E). (G–I) Electron microscopy images of Homer, Shank and Homer-Shank complex. Negative stain images of Homer1b (0.4 μM) (G), Shank1CΔPEST (0.4 μM), (H), and complex formed in the 1:1 molar ratio mixture of Homer1b and Shank1CΔPEST, each at 1 μM (I).
Figure 2
Figure 2. Interaction between the Homer-Shank complex and other PSD proteins
(A) Interaction of GKAP with the high-order complex between Homer and Shank. Increasing concentrations (0–26 μM) of GKAP fragment were added to the fixed amount of Homer1b and Shank1CΔPEST (4.3 μM each), then centrifuged. (B) The summary of three independent experiments similar to (A). The fraction of Homer1b and Shank1CΔPEST in the precipitate, and the amount of GKAP in the precipitate expressed with the intensity of precipitated Homer1b as 100%, were plotted. (C, D) Dose-dependent inhibition of the high-order complex formation between Homer and Shank by Homer1a. Increasing concentrations (0–190 μM) of Homer1a were added to Homer1b and Shank1CΔPEST (19 μM each) and centrifuged. (D) shows the summary of four repeated experiments. (E, F) Effect of CaMKIIα phosphorylation on the high-order complex formation between Homer and Shank. CaMKIIαactivated by calcium and calmodulin were added to Homer1b or Homer3a and Shank1CΔPEST (8 μM each), then centrifuged after 30 min incubation at 25°C. (F) shows the summary of three repeated experiments.
Figure 3
Figure 3. Crystal structure of the Homer coiled-coil region
(A) Ribbon representation of the crystal structure of the carboxy-terminal half of Homer1b coiled-coil region CC2. The four strands are marked A–D. (B) A model of the whole structure of long form of Homer. The model is constructed from the structure of the Homer1CC2 domain (blue), EVH1 domain (red) (Irie et al., 2002), and coiled-coil probability prediction and protease degradation sites (Hayashi et al., 2006). The CC1 and a part of the CC2 domain, whose atomic structures are not known, are in light green and light blue, respectively. Regions likely to be disordered are shown in grey. (C) Primary sequence of the crystallized fragment. 1B, rat Homer1b; 3A, human Homer3a. Orange, aliphatic residues (I, L, V); blue, acidic (D, E); green, basic (K, R); grey, residues not in crystals. Mutations made in dimeric Homer1b I332R/I337E are shown below. “abcdefg” denotes positions in the heptad of coiled-coil. (D) Distance between the A and the B strand, or the C and the D strand, are measured and plotted against the number of residues. (E) Helical wheel representation of the dimeric (top) and tetrameric (bottom) region of Homer1b. Residues start from K290 at g position. Residues which make knobs-into-holes interactions with residues on the other strands are shown in blue. Residues changed in the dimeric mutant (I332 and I337) are shown in red. Residues outside the dotted circles are located within the wide dimeric region. (F) Example of intermolecular salt bridges formed between residues at the e (E295 and E302) and g (K290 and R297) positions within the dimeric region. (G) Large amino acids occupying the a and d positions in the wide dimeric region, Q319 and F322. (H) Inter-chain interactions in the tetrameric region. Residues at d positions (L329, K336, L343, L350) form the A–D and B–C interface, and those at e positions (L330, I337, R344, L351) form the A–C and B–D interface. (I) Hydrophobic core formed by leucines at a positions (L326, L333, L340, L347).
Figure 4
Figure 4. Dimeric mutants of Homer
(A) Structure around the mutated residues. The A chain (green) and B chain (yellow) are shown with I332 and I337 in black. The surface showing the electrostatic potential of the C and D chains is made half transparent to show the I332 and I337 on strand B. (B) Elution profiles of purified Homer1b, and its mutants, from the Superose 6 gel filtration column. The void volume was 8.2 ml. (C) Representative scans of sedimentation equilibrium analysis of Homer mutants done at centrifuge speed of 12,000 rpm. This sample was also centrifuged at 9,000 rpm and 15,000 rpm, and globally fitted to the equilibration model. Deviations from the calculated equilibrium are shown at the top. The same color code as in (B) is used. (D, E) Disruption of the tetramer of wild type Homer1b by dimeric Homer1b-I332R/I337E mutant. HA-Homer1b and myc-Homer1b I332R/I337E were transfected individually or cotransfected in HEK-293T cells. The crude soluble fraction was separated with Superose 6 gel filtration column and the elution profile of each construct was monitored by Western blotting using anti-HA or anti-myc antibody. (F, G) Loss of Shank crosslinking ability of the dimeric Homer1b I332R/I337E mutant in high-speed centrifugation assay (F) and in dynamic light-scattering assay (G). The graph in (F) shows a summary of four repeated experiments. (H) Intact interaction between syntaxin 13 fragment and Homer1b wild type or Homer1b I332R/I337E mutant. Crude bacterial lysate expressing Homer1b or Homer1b I332R/I337E was loaded onto Ni-agarose beads with or without hexahistidine-tagged syntaxin 13 fragment, and eluted with imidazole. The eluted sample was separated with SDS-PAGE, and stained by Coomassie.
Figure 5
Figure 5. Effect of the dimeric mutant form of Homer on the localization of synaptic proteins
(A) Loss of spine localization of the dimeric mutant of Homer. Representative images of CA1 pyramidal neurons in slice culture transfected with mGFP fusion proteins of Homer1a, Homer1b, Homer1b I332R/I337E (green) and DsRed2 (magenta). The fluorescence profiles across the line in the images are shown at the bottom. The peaks in the middle of the plot correspond with the dendritic shaft and those to the left are spine heads. The intensity is adjusted so that the peaks in both channels at the dendritic shaft are 1. Scale bar = 2 μm. (B) Summary of spine localization of different constructs in a cumulative plot. Numbers of cells/spines analyzed are in parentheses. (C) Representative images of neurons in hippocampal dissociated culture transfected with myc-Homer1b or myc-Homer1b I332R/I337E and stained with anti-myc and anti-Shank or anti-PSD-95. Scale bar = 10 μm. (D, E) Summary of Shank and PSD-95 cluster density (D) and mean intensity of Shank and PSD-95 clusters (E) (T-test: * p < 0.05, ** p < 0.01). Data were obtained from 800–2500 dendritic spines from 6–12 transfected cells.
Figure 6
Figure 6. Effect of the dimeric mutant form of Homer on dendritic spine structure and synaptic transmission
(A, B) Morphological analysis of dendritic spines expressing Homer1b or Homer1b I332R/I337E using the cytosolic GFP expression. Representative images of hippocampal cultured neurons transfected with myc-Homer1b or myc-Homer1b I332R/I337E and GFP (A) and summary (B). The neurons were stained with anti-myc antibody. *: p < 0.05 by T-test. Data were obtained from 5310 (WT, 8 cells) and 1596 (I332R/I337E, 9 cells) dendritic spines. Scale bar, 10 μm. (C, D) Morphological analysis of dendritic spines expressing GFP and pSuper empty, GFP and expression vector for siRNA against Homer1b (pSuper-Homer1b); GFP, pSuper-Homer1b, and wild type Homer1b with mutation that makes it resistant to siRNA (Homer1bR); or GFP, pSuper-Homer1b and Homer1bR with I332R/I337E mutation (Homer1bR I332R/I337E). The neurons were stained with anti-Homer1 antibody. (C) Sample images. (D) Data were obtained from 3433 (pSuper empty, 6 cells), 4560 (siRNA Homer1b, 6 cells), 4989 (siRNA Homer1b with Homer1bR I332R/I337E, 9 cells), and 5633 (siRNA Homer1b with Homer1bR, 9 cells) dendritic spines. Scale bar, 10 μm. (E, F) Coexpression of Shank with Homer. The neurons were stained with anti-Shank or anti-Homer1 antibodies. (E) Sample images. (F) Data were obtained from 804 (Shank only, 6 cells), 852 (Shank and Homer1b, 6 cells), and 920 (Shank and Homer1b I332R/I337E, 10 cells) dendritic spines. Scale bar, 10 μm. (G–J) Synaptic response from pairs of untransfected control cells and cells transfected with either Homer1b or Homer1b I332R/I337E. (G) Sample traces. Stimulation artifacts are truncated. (H) For each pair of cells, the amplitude of AMPA-R or NMDA-R EPSCs from transfected cell is plotted against that of control cell. Homer1b, AMPA-R, n=11; NMDAR n=10; AMPA-R/NMDA-R ratio n=10. Homer1b I332R/I337E, n=10 for each measurement. (I) The ratio of amplitude in transfected cells/untransfected cells. (J) The AMPA-R/NMDA-R-EPSC ratio normalized to the untransfected cells.
Figure 7
Figure 7. The model of interaction between Homer and Shank
(A) A model of high-order complex between Homer and Shank. Currently, the oligomeric status of Shank is not known. (B) Overlay of the structural model of Homer (blue) on the PSD. The structures of mGluR1 (yellow) is modeled based on the structure of mGluR1 extracellular ligand binding domain (Kunishima et al., 2000) and the structure of rhodopsin (Palczewski et al., 2000). The structures of IP3R (red) (Sato et al., 2004), TRPC (green) (Mio et al., 2007) and dynamin (Mears et al., 2007) are taken from electron microscopy images. All structures are depicted to scale on an electron microscope image of a hippocampal CA1 spine with smooth endoplasmic reticulum, obtained and modified from Spacek et al. (1997). Copyright 1997 by the Society for Neuroscience. The presynaptic terminal (Pre), postsynaptic terminal (Post) and endoplasmic reticulum (ER) are indicated. Scale bar = 0.1 μm.

Similar articles

Cited by

References

    1. Baron MK, Boeckers TM, Vaida B, Faham S, Gingery M, Sawaya MR, Salyer D, Gundelfinger ED, Bowie JU. An architectural framework that may lie at the core of the postsynaptic density. Science. 2006;311:531–535. - PubMed
    1. Beneken J, Tu JC, Xiao B, Nuriya M, Yuan JP, Worley PF, Leahy DJ. Structure of the Homer EVH1 domain-peptide complex reveals a new twist in polyproline recognition. Neuron. 2000;26:143–154. - PubMed
    1. Boeckers TM, Liedtke T, Spilker C, Dresbach T, Bockmann J, Kreutz MR, Gundelfinger ED. C-terminal synaptic targeting elements for postsynaptic density proteins ProSAP1/Shank2 and ProSAP2/Shank3. J Neurochem. 2005;92:519–524. - PubMed
    1. Brakeman PR, Lanahan AA, O’Brien R, Roche K, Barnes CA, Huganir RL, Worley PF. Homer: a protein that selectively binds metabotropic glutamate receptors. Nature. 1997;386:284–288. - PubMed
    1. Cheng D, Hoogenraad CC, Rush J, Ramm E, Schlager MA, Duong DM, Xu P, Wijayawardana SR, Hanfelt J, Nakagawa T, et al. Relative and absolute quantification of postsynaptic density proteome isolated from rat forebrain and cerebellum. Mol Cell Proteomics. 2006;5:1158–1170. - PubMed

Publication types