. 2009 Jun;46(6):1027-36.
doi: 10.1016/j.yjmcc.2009.03.015. Epub 2009 Apr 1.

Mitochondrial free calcium regulation during sarcoplasmic reticulum calcium release in rat cardiac myocytes

Affiliations

Mitochondrial free calcium regulation during sarcoplasmic reticulum calcium release in rat cardiac myocytes

Tatyana N Andrienko et al. J Mol Cell Cardiol. 2009 Jun.

Abstract

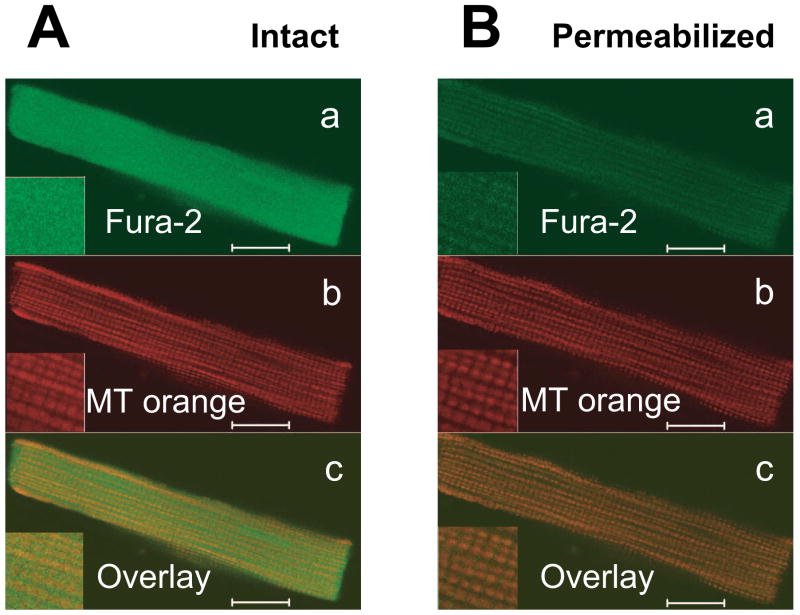
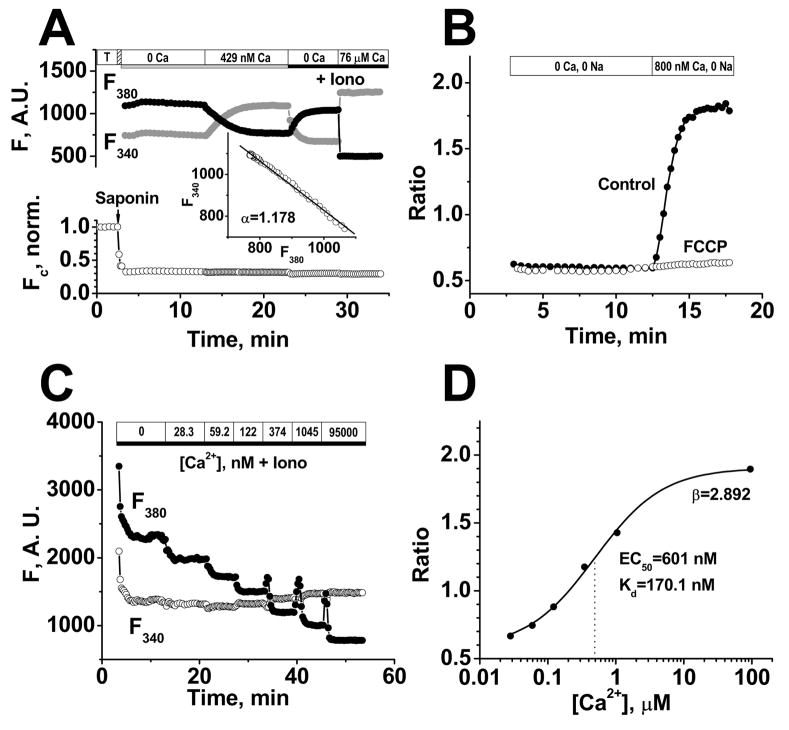
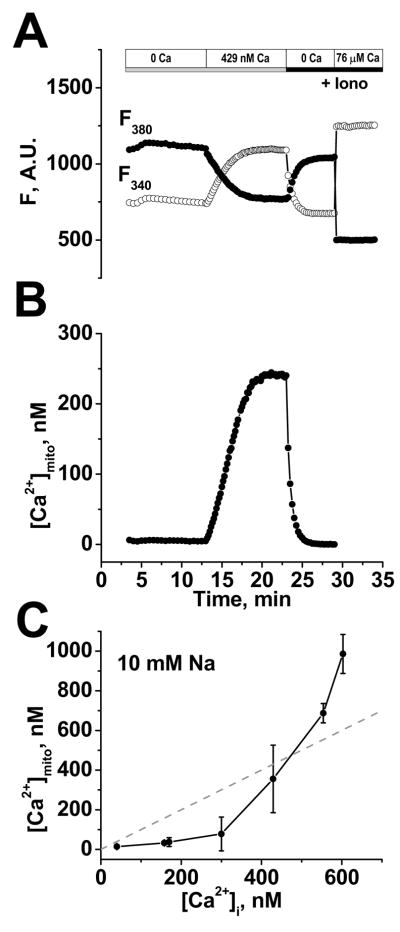
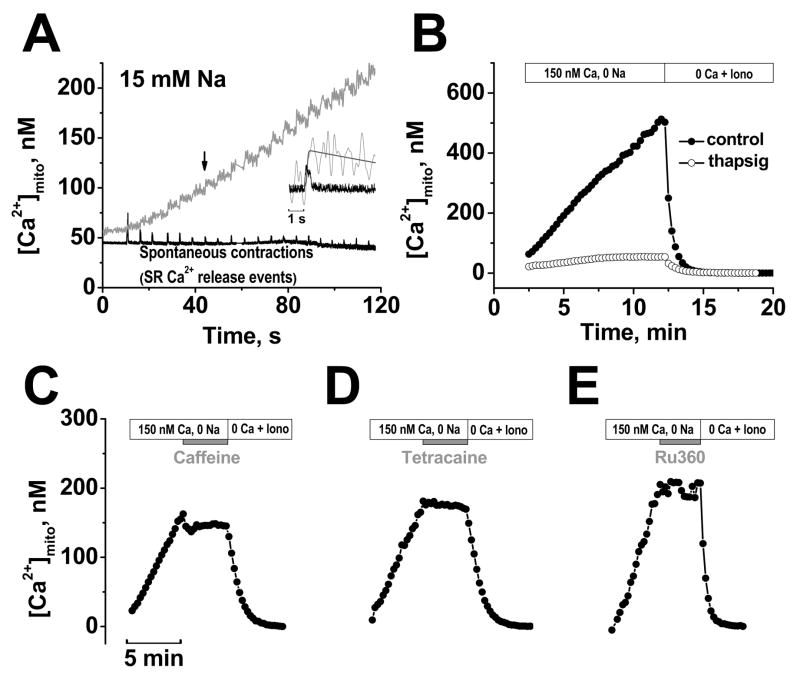
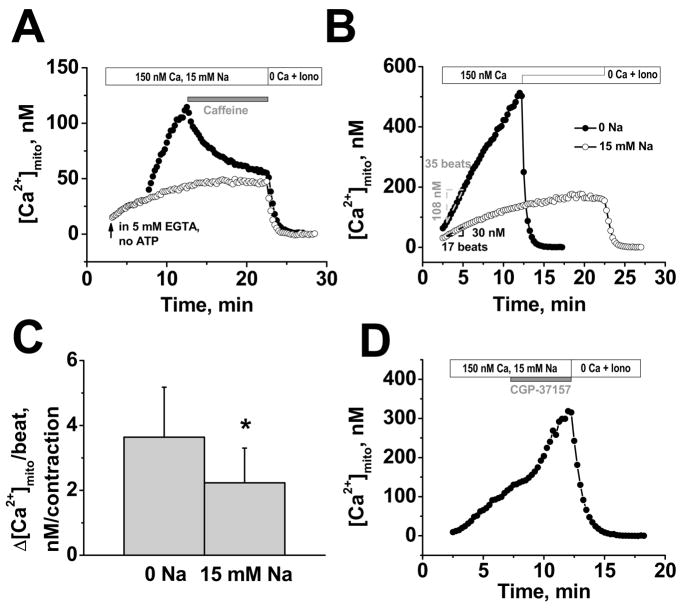
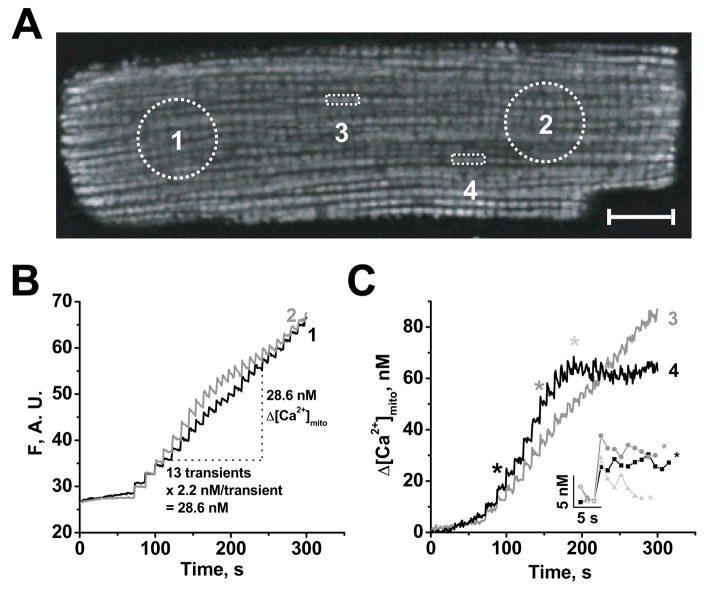
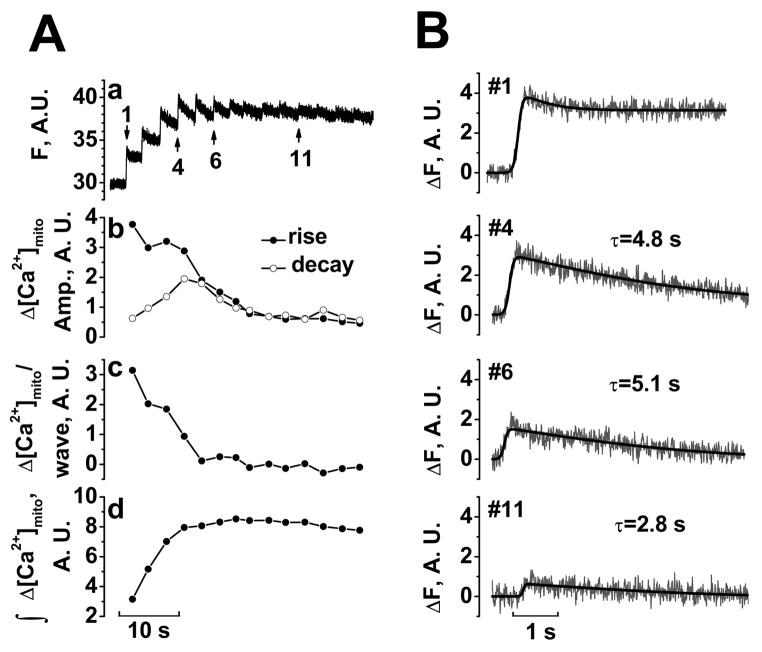
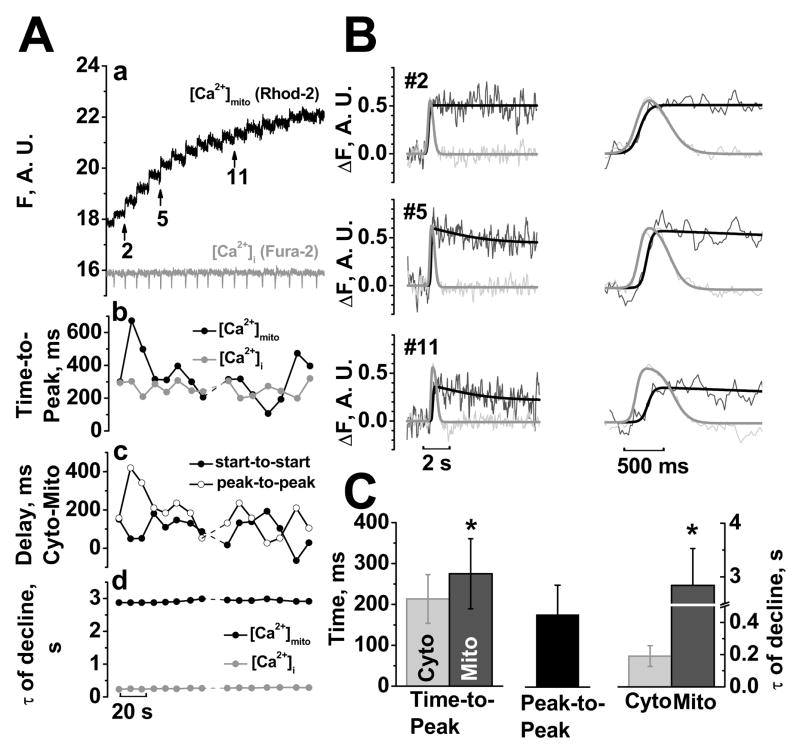
Cardiac mitochondria can take up Ca(2+), competing with Ca(2+) transporters like the sarcoplasmic reticulum (SR) Ca(2+)-ATPase. Rapid mitochondrial [Ca(2+)] transients have been reported to be synchronized with normal cytosolic [Ca(2+)](i) transients. However, most intra-mitochondrial free [Ca(2+)] ([Ca(2+)](mito)) measurements have been uncalibrated, and potentially contaminated by non-mitochondrial signals. Here we measured calibrated [Ca(2+)](mito) in single rat myocytes using the ratiometric Ca(2+) indicator fura-2 AM and plasmalemmal permeabilization by saponin (to eliminate cytosolic fura-2). The steady-state [Ca(2+)](mito) dependence on [Ca(2+)](i) (with 5 mM EGTA) was sigmoid with [Ca(2+)](mito)<[Ca(2+)](i) for [Ca(2+)](i) below 475 nM. With low [EGTA] (50 microM) and 150 nM [Ca(2+)](i) (+/-15 mM Na(+)) cyclical spontaneous SR Ca(2+) release occurred (5-15/min). Changes in [Ca(2+)](mito) during individual [Ca(2+)](i) transients were small ( approximately 2-10 nM/beat), but integrated gradually to steady-state. Inhibition SR Ca(2+) handling by thapsigargin, 2 mM tetracaine or 10 mM caffeine all stopped the progressive rise in [Ca(2+)](mito) and spontaneous Ca(2+) transients (confirming that SR Ca(2+) releases caused the [Ca(2+)](mito) rise). Confocal imaging of local [Ca(2+)](mito) (using rhod-2) showed that [Ca(2+)](mito) rose rapidly with a delay after SR Ca(2+) release (with amplitude up to 10 nM), but declined much more slowly than [Ca(2+)](i) (time constant 2.8+/-0.7 s vs. 0.19+/-0.06 s). Total Ca(2+) uptake for larger [Ca(2+)](mito) transients was approximately 0.5 micromol/L cytosol (assuming 100:1 mitochondrial Ca(2+) buffering), consistent with prior indirect estimates from [Ca(2+)](i) measurements, and corresponds to approximately 1% of the SR Ca(2+) uptake during a normal Ca(2+) transient. Thus small phasic [Ca(2+)](mito) transients and gradually integrating [Ca(2+)](mito) signals occur during repeating [Ca(2+)](i) transients.


Figures

Figure 1
Figure 1. Mitochondrial localization of fura-2 in permeabilized myocytes
Confocal images of intact rat ventricular cardiomyocyte simultaneously loaded with fura-2 and Mitotracker Orange before (A) and after sarcolemmal permeabilization by saponin (B). Top panels (a) are fura-2 signals, middle panels (b) are Mitotracker Orange, showing typical mitochondrial pattern and lower panels (c) show merged images. Fura-2 only colocalizes with mitochondria after permeabilization. Scale bars are equal 10 μm.
FIGURE 2
FIGURE 2. Mitochondrial free [Ca2+] measurements with fura-2
A, Top traces show background-corrected fura-2 fluorescence at 340 and 380 nm excitation after permeabilization. The inset shows plot of F340 vs. F380 as [Ca2+]mito varies to determine αand allows measurement of Fc (Ca2+-independent fura-2 fluorescence) in bottom normalized trace showing loss of 70% of fura-2 upon permeabilization. B, Rise in [Ca2+]mito in the presence of 800 nM Ca2+ and in the absence of Na+ (±2.5 μM FCCP added 2 min prior to increasing [Ca2+]i). C, In situ calibration of background subtracted fura-2 fluorescence in permeabilized cells in the presence of 3 μM ionomycin (Iono), 10 μM FCCP and 20 μg/mL oligomycin. D, Fura-2 ratio dependence on [Ca2+]i for data in C fit to [Ca2+] = Kdβ(R-Rmin)/(Rmax-R), where EC50 = Kdβ and β = F380-max/F380-min.
FIGURE 3
FIGURE 3. Steady-state dependence of [Ca2+]mito on [Ca2+]i
A, example of background-corrected raw F340 and F380 380 nm signals, where [Ca2+]i was raised from 0 to 429 nM, with Rmin and Rmax measured at the end using ionophores (Iono). B, calibrated [Ca2+]mito calculated from A. C, Steady-state dependence of [Ca2+]mito on [Ca2+]i in the presence of 10 mM Na+ (Mean ±SD, n=3–7 myocytes).
FIGURE 4
FIGURE 4. [Ca2+]mito during cyclical SR Ca2+ release
A, Simultaneous recording of [Ca2+]mito (grey) and contractions (black) in the presence of 150 nM Ca2+ and 15 mM Na+. 40 μM cytochalasin D was included to limit contraction. Inset shows expanded superimposed traces for the 7th contraction (traces smoothed by fast Fourier transform). B, [Ca2+]mito under control conditions and after pretreated with 1 μM thapsigargin for 30 min. Mitochondrial Ca2+ uptake was halted by acute application of 10 mM caffeine (C), 2 mM tetracaine (D), or 1 μM Ru360 (E). Each experiment ended with Ca2+-free solution with ionophores (Iono) to start calibration.
FIGURE 5
FIGURE 5. Calibrated rise in [Ca2+]mito per beat and [Na+]i-dependence
A, 10 mM caffeine stops [Ca2+]mito, but with 15 mM Na+ [Ca2+]mito declines (filled symbols); mitochondrial Ca2+ uptake in presence of 5 mM EGTA (empty symbols). B, examples of [Ca2+]mito increase per contraction (±15 mM Na+). C, Average increase of [Ca2+]mito per contraction (±15 mM Na+). D, Blockade of NCXm (5 μM CGP-37157) increases rate of [Ca2+]mito rise in presence of 15 mM Na+. Each experiment ended with Ca2+-free solution with ionophores (Iono) to start calibration.
FIGURE 6
FIGURE 6. Spatially resolved [Ca2+]mito during SR Ca2+ release
A, confocal image of permeabilized rat ventricular myocyte loaded with 10 μM rhod-2 AM, after 5 min of spontaneous Ca2+ transients in 15 mM Na+ (with 80 μM cytochalasin D) with 4 regions of interest (ROI) indicated. Scale bar is equal 10 μm. B-C, Time courses of [Ca2+]mito in 4 ROIs, either as fluorescence (F in arbitrary units, B) or calibrated Δ[Ca2+]mit (C) using averaged Δ[Ca2+]mito/beat from Fig. 5C (see B and text). C, ROI 3 and 4 contain 3 mitochondria and inset shows the indicated [Ca2+]mito transients expanded.
FIGURE 7
FIGURE 7. Mitochondrial [Ca2+] balance during SR Ca2+ release
Aa, [Ca2+]mito measured in line-scan images in permeabilized myocyte loaded with 5 μM rhod-2 AM in 15 mM Na+ (with 80 μM cytochalasin D; subjected to 5 point smoothing). Ab, Amplitudes of rise (filled symbols) and decay phase (empty symbols). Ac, Net gain in [Ca2+]mito per wave. Ad, Integral of change in [Ca2+]mito. B, Expanded and curve fitting for the transients indicated in A.
FIGURE 8
FIGURE 8. Kinetics of [Ca2+]mito vs. [Ca2+]i signals
Aa, [Ca2+]mito and [Ca2+]i measured in line-scan images in permeabilized myocyte with mitochondrial rhod-2 and 5 μM cytosolic fura-2 salt (15 mM Na+, 80 μM cytochalasin D, 5 point smoothing). Ab, Time-to-Peak (rise time for either [Ca2+]mito or [Ca2+]i). Ac, Delay of [Ca2+]mito after [Ca2+]i as start-to-start and peak-to-peak, Ad, time constant τof decline. B, Curve fitting and expanded mitochondrial (black) and cytosolic (grey) transients indicated in Aa. C, Difference in mitochondrial and cytosolic kinetics (n=3 cells, 25 transients).

Comment in

  • Ca2+ dynamics in the mitochondria - state of the art.
    Chikando AC, Kettlewell S, Williams GS, Smith G, Lederer WJ. Chikando AC, et al. J Mol Cell Cardiol. 2011 Nov;51(5):627-31. doi: 10.1016/j.yjmcc.2011.08.003. Epub 2011 Aug 16. J Mol Cell Cardiol. 2011. PMID: 21864537 Free PMC article.

Similar articles

Cited by

References

    1. Denton RM, McCormack JG. Ca2+ as a second messenger within mitochondria of the heart and other tissues. Annu Rev Physiol. 1990;52:451–66. - PubMed
    1. Bers DM. Calcium cycling and signaling in cardiac myocytes. Annu Rev Physiol. 2008;70:23–49. - PubMed
    1. Gunter TE, Pfeiffer DR. Mechanisms by which mitochondria transport calcium. Am J Physiol. 1990 May;258(5 Pt 1):C755–86. - PubMed
    1. Kirichok Y, Krapivinsky G, Clapham DE. The mitochondrial calcium uniporter is a highly selective ion channel. Nature. 2004 Jan 22;427(6972):360–4. - PubMed
    1. Buntinas L, Gunter KK, Sparagna GC, Gunter TE. The rapid mode of calcium uptake into heart mitochondria (RaM): comparison to RaM in liver mitochondria. Biochim Biophys Acta. 2001 Apr 2;1504(2–3):248–61. - PubMed

Publication types