

A comparison of Lea Symbol vs ETDRS letter distance visual acuity in a population of young children with a high prevalence of astigmatism
- PMID: 19345596
- PMCID: PMC2764356
- DOI: 10.1016/j.jaapos.2009.01.007
A comparison of Lea Symbol vs ETDRS letter distance visual acuity in a population of young children with a high prevalence of astigmatism
Abstract
Purpose: To compare visual acuity results obtained by use of the Lea Symbols chart with results obtained with Early Treatment Diabetic Retinopathy Study (ETDRS) charts in young children who are members of a population with a high prevalence of astigmatism.
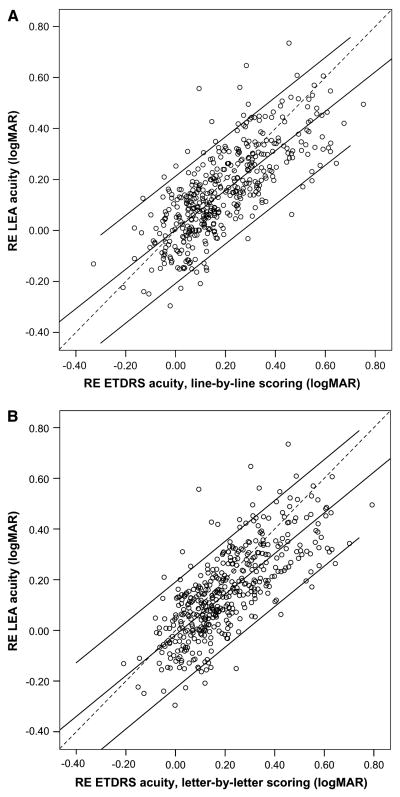
Methods: Subjects were 438 children ages 5 through 7 years who were enrolled in kindergarten or first grade on the Tohono O'odham Reservation: 241 (55%) had astigmatism >or=1.00 D in one or both eyes (range, 0.00-6.75 D). While wearing best correction, each child had right eye visual acuity tested with the 62 cm by 65 cm Lea Symbols chart at 3 m and with the 62 cm by 65 cm ETDRS chart at 4 m. Visual acuity was scored as the smallest optotype size at which the child correctly identified 3 of a maximum of 5 optotypes. ETDRS visual acuity also was scored based on the total number of letters that the child correctly identified.
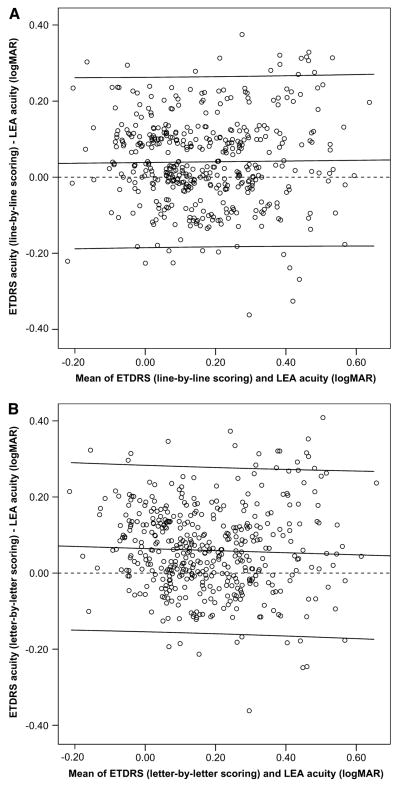
Results: Correlation between Lea Symbols visual acuity and ETDRS visual acuity was 0.78 (p < 0.001). Mean Lea Symbols visual acuity was one-half line (0.04-0.06 logMAR) better than mean ETDRS visual acuity (p < 0.001). The difference between Lea Symbols and ETDRS visual acuity was not correlated with the mean of the Lea Symbols and ETDRS visual acuity scores, which ranged from -0.3 logMAR (20/10) to 0.74 logMAR (20/110).
Conclusions: In this population of young children, in whom the primary source of reduced visual acuity is astigmatism-related amblyopia, the Lea Symbols chart produced visual acuity scores that were about 0.5 line better than visual acuity scores obtained with ETDRS charts.
Conflict of interest statement
The authors have no financial interest in any of the tests used in this study.
Figures
References
-
- Ferris FL, Kassoff A, Bresnick GH, Bailey I. New visual acuity charts for clinical research. Am J Ophthalmol. 1982;94:91–6. - PubMed
-
- Committee on Vision. Recommended standard procedures for the clinical measurement and specification of visual acuity. Adv Ophthalmol. 1980;41:103–48. - PubMed
-
- Hyvärinen L, Näsänen R, Laurinen P. New visual acuity test for pre-school children. Acta Ophthalmol (Copenh) 1980;58:507–11. - PubMed
-
- Gräf MH, Becker R, Kaufmann H. Lea Symbols: Visual acuity assessment and detection of amblyopia. Graefe’s Arch Cliin Exp Ophthalmol. 2000;238:53–8. - PubMed
-
- Vision In Preschoolers (VIP) Study Group. Visual acuity results in school-aged children and adults: Lea Symbols chart versus Bailey-Lovie Chart. Optom Vis Sci. 2003;80:650–54. - PubMed
Publication types
MeSH terms
Grants and funding
LinkOut - more resources
Full Text Sources
