. 2009 Jul;19 Suppl 1(Suppl 1):i70-7.
doi: 10.1093/cercor/bhp029. Epub 2009 Apr 3.

A stem cell niche for intermediate progenitor cells of the embryonic cortex

Affiliations

A stem cell niche for intermediate progenitor cells of the embryonic cortex

Ashkan Javaherian et al. Cereb Cortex. 2009 Jul.

Abstract

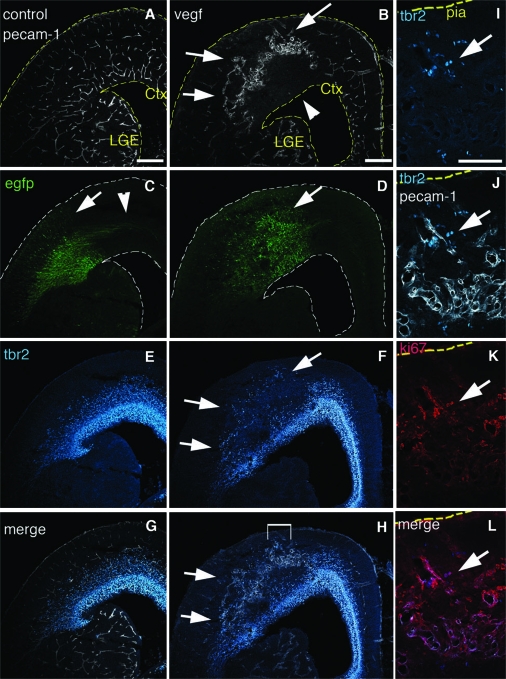
The excitatory neurons of the mammalian cerebral cortex arise from asymmetric divisions of radial glial cells in the ventricular zone and symmetric division of intermediate progenitor cells (IPCs) in the subventricular zone (SVZ) of the embryonic cortex. Little is known about the microenvironment in which IPCs divide or whether a stem cell niche exists in the SVZ of the embryonic cortex. Recent evidence suggests that vasculature may provide a niche for adult stem cells but its role in development is less clear. We have investigated the vasculature in the embryonic cortex during neurogenesis and find that IPCs are spatially and temporally associated with blood vessels during cortical development. Intermediate progenitors mimic the pattern of capillaries suggesting patterns of angiogenesis and neurogenesis are coordinated during development. More importantly, we find that IPCs divide near blood vessel branch points suggesting that cerebral vasculature establishes a stem cell niche for intermediate progenitors in the SVZ. These data provide novel evidence for the presence of a neurogenic niche for intermediate progenitors in the embryonic SVZ and suggest blood vessels are important for proper patterning of neurogenesis.


Figures

Figure 1.
Figure 1.
Tbr2 cells and blood vessels are temporally and spatially connected. (AC) Collapsed confocal stacks of cortical E12 (AC) and E14 (DF) whole-mounts stained for PECAM-1 in (A, D) (red), Tbr2 in (B, E) (green), and merged in (C, F). Lateral is to the left. Note that there are more Tbr2 cells laterally at E12 (A, bracket) and that this area is also more vascularized (B, C, bracket). Tbr2 cells are also associated with the leading edge of growing vasculature (arrows). (DF) At E14 Tbr2 cells are arranged in rows aligned with the pattern of developing blood vessels (arrows in F). Note that the typical linear arrangement of Tbr2 cells becomes obvious even without staining for the vasculature (E and F). (G) Quantification of Tbr2 cells at E12. Images similar to (C) were quantified. There are significantly more Tbr2 cells in areas that are vascularized (76 vs. 24%, paired Student's t-test P < 0.05, N = 2288 cells from 3 animals). l = lateral, m = medial. (H) Confocal stack of PECAM-1 stained E13 cortex. Note the tip cell filopodia are near Tbr2 cells. (I) Ninety degrees rotation of a confocal stack through E14 cortex showing staining for Tbr2 (green) and PECAM-1 (red) where only surface Tbr2 cells were imaged by turning off the laser imaging the Tbr2 stain during collection of optical stacks (arrow; also see main text). The laser imaging PECAM-1 staining was used to capture all blood vessels (bracket). (J) Collapsed confocal stacks of DAPI (white), Tbr2 (green), and PECAM-1 (red). Distance between surface Tbr2 cells and overlying vasculature was measured (arrows show example measurement bars: yellow lines from Tbr2 cell to blood vessels) and a similar measurement was made of all DAPI cells within the same region. (D3) Cumulative probability histogram of the proportion of Tbr2 cells (green) close to blood vessels as compared with proportion of DAPI nuclei (black). Tbr2 cells are significantly closer to blood vessels (P < 0.0001, Kolmogorov-Smirnov [KS] normality test). VZ = ventricular zone. Scale bars: (AC) 50 μm, (DF) 100 μm, (H) 20 μm, (I) 50 μm, (J) 10 μm.
Figure 2.
Figure 2.
Confocal stack through the SVZ of Tbr2 transgenic at E13 shows Tbr2:EGFP cells (A) are aligned in a honeycomb pattern that resembles the vasculature in (B) labeled with Alexa-594-Lectin. (C) Merged image shows the GFP cells overlap with vasculature (arrows). (D) Same confocal stack as in (AC) but rotated 90° to mimic a coronal view. Note that the majority of EGFP cells aligned with the vasculature (shown in F) are not adjacent to the blood vessels but have migrated 30–50 μm toward the cortical plate (arrows). (E) Confocal optical Z section of E14 lateral cortex stained for endogenous Tbr2 (blue), PECAM-1 (red), and PH3 (green). Tbr2/PH3 double positive cells are adjacent to blood vessels (arrows). Tbr2 density is increased in the basal region of the SVZ in lateral cortex at this age and Tbr2 cells are now also found in areas between blood vessels (blue, arrowhead). (F) Cartoon schematic of (E) emphasizes that Tbr2/PH3 double positive cells are near blood vessel branch points. (G) The vessel segments between branch points were divided into 4 quadrants. The distance of cell bodies to each segment was measured with quadrant 1 being nearest the cell. (G’) Quantification of Tbr2/PH3 cells shows that Tbr2 cells are preferentially located near branch points. (HM) Tbr2 cells are associated with vasculature in VEGF electroporated brains. (H) Ventricular view shows region of electroporated at E13 and imaged at E17. (I) PECAM-1 staining shows blood vessels have formed a ring-like structure surrounding the electroporated area. (J) Tbr2 staining of the tissue in (H) and (I) shows that Tbr2 cell distribution matches the altered blood vessel geometry and forms a ring-like pattern (arrow). (KM) Higher magnification shows Tbr2 cells associated with the leading edge of developing vasculature (arrow). Scale bars: (AC, E, KM) 100 μm, (DG) 30 μm, (H, I) 200 μm.
Figure 3.
Figure 3.
Tbr2 cells are associated with ectopic blood vessels. E13 animals were electroporated in utero with EGFP (A, C, E, G) or coelectroporated with EGFP and VEGF-A (B, D, F, H) and visualized at E17. (A) PECAM-1 immunofluorescence of control sections shows the cortex is vascularized throughout. (B) PECAM-1 staining of VEGF electroporated brain shows blood vessels are grossly abnormal and enlarged in the electroporated area (arrows), whereas the underlying region is less vascularized (arrowhead). (C) In controls EGFP labeled radially oriented cells are present in the VZ, SVZ, and cortical plate (arrow) with GFP axons leaving the electroporated region (arrowhead). (D) VEGF exposed brains have a dysplastic morphology in the electroporated region (arrow), and have fewer radially oriented cells and axons. (E) Tbr2 immunostaining of the same control sections shows Tbr2 cells distributed in the cortical SVZ. (F) Tbr2 staining of VEGF electroporated brains shows Tbr2 cells are ectopically present in the cortical plate where they are normally never found (arrows). (G, H) Merged images of Tbr2 and PECAM staining of controls and VEGF electroporated brains respectively. Bracketed area in (H) is magnified in (IL). (I) Ectopic Tbr2 cells in VEGF treated brains. (J) Tbr2 and PECAM-1 staining merged. (K) Same section as (I) and (J) colabeled with the proliferative marker Ki67. (L) Tbr2 and Ki67 Merged. Arrow shows Tbr2 cells near the pia that are double labeled with Ki67. ctx = Cortex, lge = Lateral Ganglionic Eminence Scale bars: (AH) 200 μm, (IL) 100 μm.

References

    1. Anthony TE, Klein C, Fishell G, Heintz N. Radial glia serve as neuronal progenitors in all regions of the central nervous system. Neuron. 2004;41:881–890. - PubMed
    1. Bovetti S, Hsieh YC, Bovolin P, Perroteau I, Kazunori T, Puche AC. Blood vessels form a scaffold for neuroblast migration in the adult olfactory bulb. J Neurosci. 2007;27:5976–5980. - PMC - PubMed
    1. Breier G, Albrecht U, Sterrer S, Risau W. Expression of vascular endothelial growth factor during embryonic angiogenesis and endothelial cell differentiation. Development. 1992;114:521–532. - PubMed
    1. Breier G, Clauss M, Risau W. Coordinate expression of vascular endothelial growth factor receptor-1 (flt-1) and its ligand suggests a paracrine regulation of murine vascular development. Dev Dyn. 1995;204:228–239. - PubMed
    1. Calabrese C, Poppleton H, Kocak M, Hogg TL, Fuller C, Hamner B, Oh EY, Gaber MW, Finklestein D, Allen M, et al. A perivascular niche for brain tumor stem cells. Cancer Cell. 2007;11:69–82. - PubMed

Publication types