. 2009 Jun;150(2):772-85.
doi: 10.1104/pp.108.133629. Epub 2009 Apr 3.

Multilevel analysis of primary metabolism provides new insights into the role of potassium nutrition for glycolysis and nitrogen assimilation in Arabidopsis roots

Affiliations

Multilevel analysis of primary metabolism provides new insights into the role of potassium nutrition for glycolysis and nitrogen assimilation in Arabidopsis roots

Patrick Armengaud et al. Plant Physiol. 2009 Jun.

Abstract

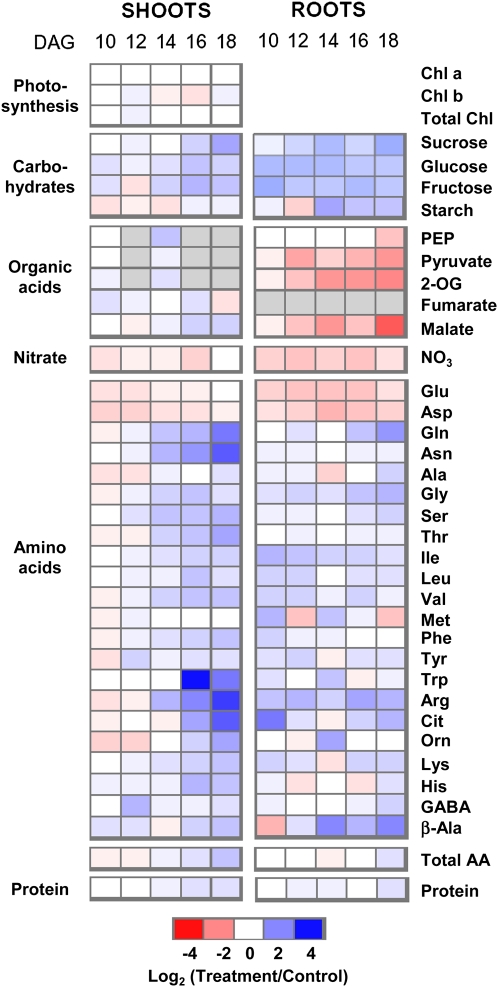
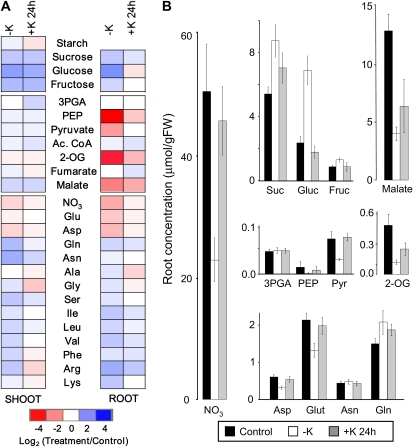
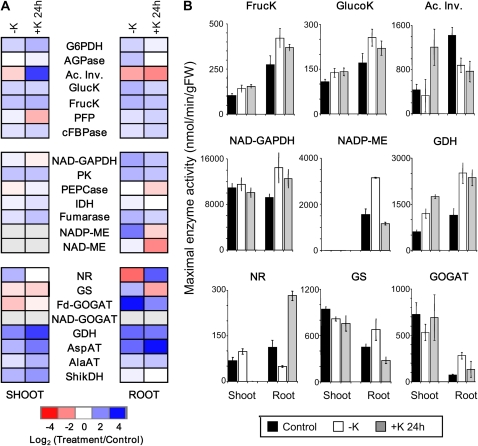
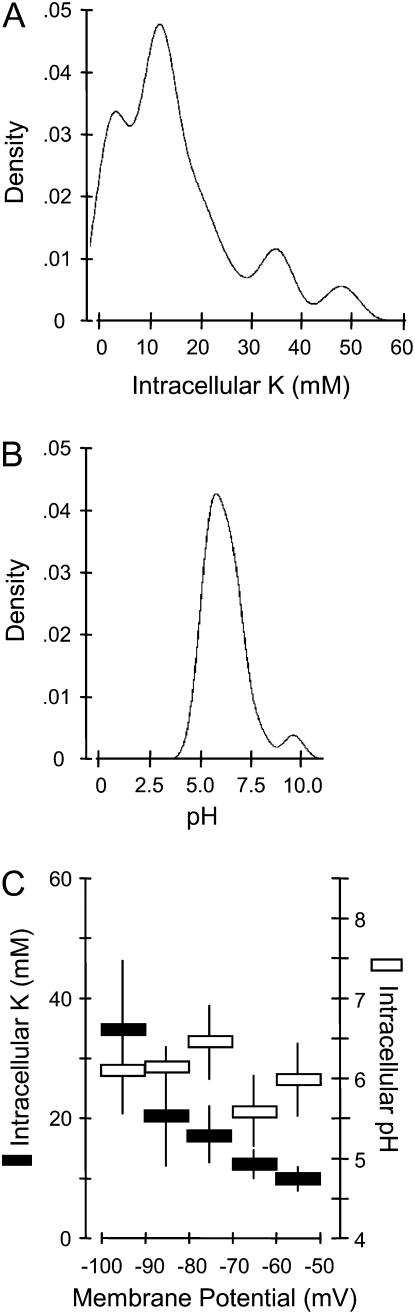
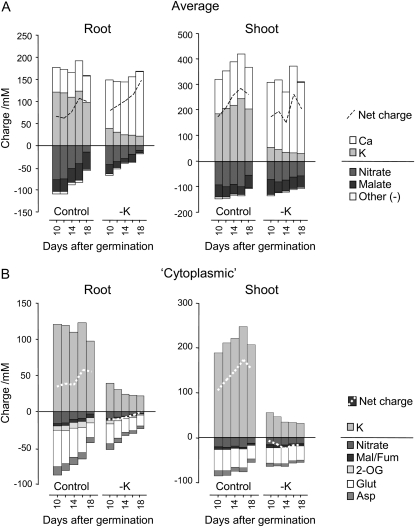
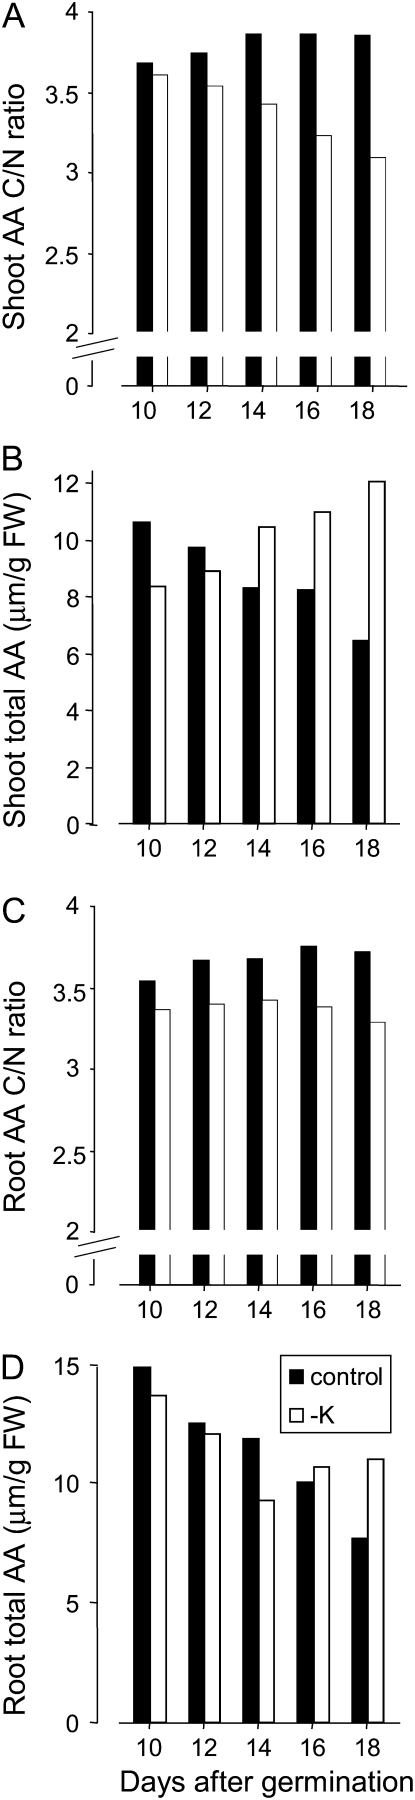
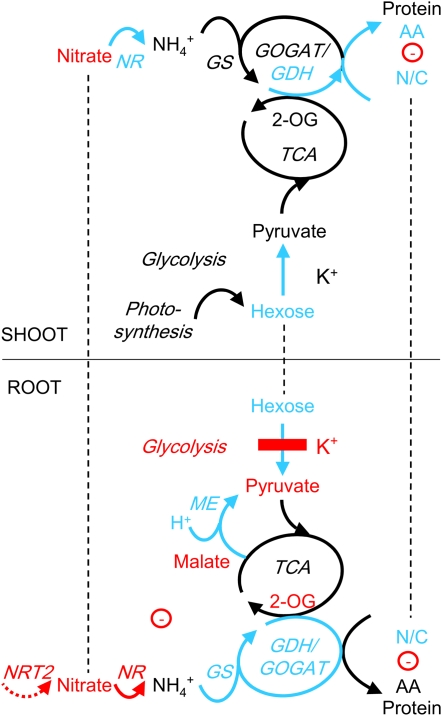
Potassium (K) is required in large quantities by growing crops, but faced with high fertilizer prices, farmers often neglect K application in favor of nitrogen and phosphorus. As a result, large areas of farmland are now depleted of K. K deficiency affects the metabolite content of crops with negative consequences for nutritional quality, mechanical stability, and pathogen/pest resistance. Known functions of K in solute transport, protein synthesis, and enzyme activation point to a close relationship between K and metabolism, but it is unclear which of these are the most critical ones and should be targeted in biotechnological efforts to improve K usage efficiency. To identify metabolic targets and signaling components of K stress, we adopted a multilevel approach combining transcript profiles with enzyme activities and metabolite profiles of Arabidopsis (Arabidopsis thaliana) plants subjected to low K and K resupply. Roots and shoots were analyzed separately. Our results show that regulation of enzymes at the level of transcripts and proteins is likely to play an important role in plant adaptation to K deficiency by (1) maintaining carbon flux into amino acids and proteins, (2) decreasing negative metabolic charge, and (3) increasing the nitrogen-carbon ratio in amino acids. However, changes in transcripts and enzyme activities do not explain the strong and reversible depletion of pyruvate and accumulation of sugars observed in the roots of low-K plants. We propose that the primary cause of metabolic disorders in low-K plants resides in the direct inhibition of pyruvate kinase activity by low cytoplasmic K in root cells.


Figures

Figure 1.
Figure 1.
Changes in metabolite concentrations in roots and shoots of Arabidopsis grown on low K. For each time point, approximately 200 plants were pooled. Blue color indicates an increase and red indicates a decrease in metabolite concentration in low-K-grown plants compared with control plants. Different shades of red and blue express the extent of the change according to the color bar provided (log2 ratio of low K to control). White indicates no change; gray indicates not determined. For absolute values, see Supplemental Table S1. AA, Amino acids; Chl, chlorophyll.
Figure 2.
Figure 2.
Reversibility of metabolite changes induced by low K. A, Changes in metabolite concentrations in roots and shoots of 2-week-old Arabidopsis plants grown in low-K (–K) medium for 14 d and subsequently resupplied with K (+K) for 24 h. Changes are in relation to corresponding values measured in plants grown in control medium. Colors and shading are as in Figure 1. B, Absolute concentrations of selected metabolites in the roots of plants grown in control medium (black bars), –K medium (white bars), and –K medium with K added for 24 h (gray bars). Data are means from at least three independently grown and treated plant batches, each of which comprised approximately 100 plants. Raw data and statistics are supplied in Supplemental Table S2. (Note that PEP concentrations were close to the detection limit, so relative changes shown in A should be viewed with caution.) Ac. CoA, Acetyl-CoA; FW, fresh weight; 3PGA, 3-phosphoglycerate; Pyr, pyruvate.
Figure 3.
Figure 3.
Changes in maximal enzyme activities under low K and K resupply. A, Changes in maximal enzyme activities in roots and shoots of 2-week-old Arabidopsis plants grown in low-K (–K) medium for 14 d and subsequently resupplied with K (+K) for 24 h. Changes are in relation to corresponding values measured in plants grown in control medium. Colors and shading are as in Figure 1. B, Absolute activities of selected enzymes (in nmol min−1 g−1 fresh weight [FW]) in the roots and shoots of plants grown in control medium (black bars), –K medium (white bars), and –K medium with K added for 24 h (gray bars). Data are means from three independently grown and treated plant batches, each of which comprised approximately 100 plants. Raw data and statistics are supplied in Supplemental Table S2. Ac. Inv., Acid invertase; AGPase, ADP-Glc pyrophosphorylase invertase; AlaAT, alanine aminotransferase; AspAT, aspartate aminotransferase; cFBPase, cytosolic Fru biphosphatase; FrucK, fructokinase; GlucK, glucokinase; G6PDH, Glc-6-P dehydrogenase; IDH, isocitrate dehydrogenase; PEPCase, PEP carboxylase; PFP, pyrophosphate-dependent phosphofructokinase; ShikDH, shikimate dehydrogenase.
Figure 4.
Figure 4.
Intracellular K concentrations and pH in epidermal root cells of low-K Arabidopsis plants. A, Distribution frequency of intracellular concentrations of K determined in 2-week-old plants by impalement with K-selective microelectrodes (n = 37 plants). B, Distribution frequency of intracellular pH determined by impalement with pH-selective microelectrodes (n = 20 plants). C, K concentration and pH within a particular range of simultaneously measured membrane potentials. Means ± se of measurements in individual plants are shown in black for K (mm) and in white for pH.
Figure 5.
Figure 5.
Electric charges provided by inorganic ions and metabolites. Charge concentration was calculated by multiplying metabolite concentration (as listed in Supplemental Table S1) by the overall charge of the molecule. Plants and growth conditions were as described for Figure 1. A, Charges based on tissue concentrations. These are dominated by the vacuolar lumen. B, Predicted charges in the cytoplasm calculated according to published data for relative cytoplasmic/vacuolar concentrations and volume (see “Materials and Methods”).
Figure 6.
Figure 6.
Effect of K deficiency on the C-N ratio of amino acids. C-N ratios of all measured amino acids (A and C) and total amino acid concentrations (B and D) in shoots (A and B) and roots (C and D) of plants growing in control (black bars) and low-K (white bars) medium over the indicated course of time are shown. Plants and growth conditions are as described for Figure 1. C and N concentrations were calculated by multiplying the number of C and N atoms in each amino acid (AA) by the concentration of the respective amino acid (as listed in Supplemental Table S1). FW, Fresh weight.
Figure 7.
Figure 7.
Scheme summarizing the effects of low K on primary metabolism in root and shoot cells of Arabidopsis. Biochemical and transport pathways are indicated with solid and dashed arrows, respectively. Increases in metabolite concentrations and enzyme activities under K deficiency are shown in blue, and decreases are shown in red. Putative direct inhibition of PK by low K is indicated with the red bar. Dashed lines indicate the exchange of metabolites between roots and shoots. Negative electric charge is given as a circled minus. AA, Amino acids; N/C, N-C ratio of the total amino acid pool; NRT2, nitrate transporter 2.

References

    1. Amtmann A, Blatt MR (2009) Regulation of macronutrient transport. New Phytol 181 35–52 - PubMed
    1. Amtmann A, Troufflard S, Armengaud P (2008) The effect of potassium nutrition on pest and disease resistance in plants. Physiol Plant 133 682–691 - PubMed
    1. Andrist-Rangel Y, Edwards AC, Hillier S, Oborn I (2007) Long-term K dynamics in organic and conventional mixed cropping systems as related to management and soil properties. Agric Ecosyst Environ 122 413–426
    1. Armengaud P, Breitling R, Amtmann A (2004) The potassium-dependent transcriptome of Arabidopsis reveals a prominent role of jasmonic acid in nutrient signaling. Plant Physiol 136 2556–2576 - PMC - PubMed
    1. Armengaud P, Zambaux K, Hills A, Sulpice R, Pattison RJ, Blatt MR, Amtmann A (2009) EZ-Rhizo: integrated software for fast and accurate measurement of root system architecture. Plant J 57 945–956 - PubMed

Publication types

MeSH terms