. 2009 Apr 21;106(16):6501-6.
doi: 10.1073/pnas.0810590106. Epub 2009 Apr 3.

Identification of a fluorescent general anesthetic, 1-aminoanthracene

Affiliations

Identification of a fluorescent general anesthetic, 1-aminoanthracene

Christopher A Butts et al. Proc Natl Acad Sci U S A. .

Abstract

We identified a fluorophore, 1-aminoanthracene (1-AMA), that is anesthetic, potentiates GABAergic transmission, and gives an appropriate dissociation constant, K(d) approximately 0.1 mM, for binding to the general anesthetic site in horse spleen apoferritin (HSAF). 1-AMA fluorescence is enhanced when bound to HSAF. Thus, displacement of 1-AMA from HSAF by other anesthetics attenuates the fluorescence signal and allows determination of K(d), as validated by isothermal titration calorimetry. This provides a unique fluorescence assay for compound screening and anesthetic discovery. Additional electrophysiology experiments in isolated cells indicate that 1-AMA potentiates chloride currents elicited by GABA, similar to many general anesthetics. Furthermore, 1-AMA reversibly immobilizes stage 45-50 Xenopus laevis tadpoles (EC(50) = 16 microM) and fluorescence micrographs show 1-AMA localized to brain and olfactory regions. Thus, 1-AMA provides an unprecedented opportunity for studying general anesthetic distribution in vivo at the cellular and subcellular levels.


Conflict of interest statement

The authors declare no conflict of interest.

Figures

Fig. 1.
Fig. 1.
Proposed binding site for 1-AMA. (A) Ferritin dimer composed of two 4-helix bundles (blue) with interfacial cavity residues shown in surface representation: polar (red), nonpolar (tan), and Arg-59 (white). (B) Conformation of cavity residues and 1-AMA after energy minimization: the ligand rotates from its initial docked position, and the two Arg-59 residues (now in white wire frame) arc away from the cavity to accommodate the ligand amino group. Other cavity residues are largely unaffected by ligand binding. (C) The 4-helix bundle motif is also found in the transmembrane domains of anesthetic-sensitive Cys loop receptor subunits. The nicotinic acetylcholine receptor (PDB ID code 2BG9) (36) is shown with the transmembrane domains of 2 of the 5 subunits highlighted in blue; the interface between the subunits contains numerous gaps in protein density that could offer potential anesthetic binding sites. Horizontal lines indicate the membrane-water interface.
Fig. 2.
Fig. 2.
Fluorescence assay measuring binding of 1-AMA to HSAF. To a 1-mL solution of 1-AMA (1 μM–1.25 mM) in 10% PEG-400/PBS, pH 7, was added 20 μL of 38 mg/mL HSAF (final [HSAF dimer] = 18.6 μM). Samples were excited at 380 nm and fluorescence monitored at 515 nm. Intensities from “bound” 1-AMA were obtained by subtracting contributions from HSAF and unbound 1-AMA. All trials were run in triplicate at 298 K. Data and error analysis was carried out by using Prism4.0 (GraphPad Software, Inc.).
Fig. 3.
Fig. 3.
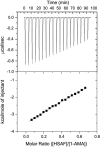
Isotherm of HSAF titration into 1-AMA. HSAF (0.67 mM) in 10% PEG-400 and PBS, pH 7, was loaded into the ITC syringe (0.286 mL), and 1-AMA (0.22 mM) in the same 10% PEG solution was loaded into the cell (1.43 mL). Titrations were performed at 298 K by using a VP ITC (Microcal). (Upper) Raw heat data (μcal/s) versus time (min). (Lower) Normalized integrated data (kcal/mol HSAF vs. molar ratio, [HSAF]/[1-AMA]). Origin 5.0 (Microcal Software) was used to fit thermodynamic parameters for a single-class-binding model to the heat profiles.
Fig. 4.
Fig. 4.
Determination of isoflurane binding to HSAF through 1-AMA displacement. (Left) Fluorescence spectra after addition of 1 μM to 4.5 mM isoflurane to HSAF (313 nM) preequilibrated with 10.5 μM 1-AMA. Samples excited at 380 nm. Downward arrow indicates AMA displacement on isoflurane titration. Dashed line indicates 1-AMA alone in solution. HSAF (bottom spectrum) contributes little to fluorescence at 520 nm. (Right) Plot of isoflurane occupancy vs. isoflurane concentration after displacement of 1-AMA from HSAF. Error bars indicate standard error of data points from titrations performed in triplicate. Curve fitting (red line) was performed in Igor Pro 4.01 (Wave Metrics).
Fig. 5.
Fig. 5.
Anesthetic potency of 1-AMA in Xenopus tadpoles determined from measuring startle response according to the procedure of Xi et al. (37). Tadpoles (n = 10–15) incubated in pond water for 1 h were tested at several different concentrations of 1-AMA (1–33 μM), with the final concentration determined by UV-visible (UV-vis) spectroscopy. The startle response was measured by sharply tapping on the top of each dish with a wooden applicator, averaged over 3 taps. Percent responses vs. concentration data were fitted to variable slope Hill curves by using GraphPad Prism4.0.
Fig. 6.
Fig. 6.
Fold change of chloride current in the presence of 4 μM GABA and 1-AMA at the shown concentrations normalized to the effect of 4 μM GABA alone. Each bar represents recordings from n cells. (Inset) Measurement of chloride current with 4 μM GABA and varying concentrations of 1-AMA (0–30 μM).
Fig. 7.
Fig. 7.
Confocal micrographs of albino stage 45–50 Xenopus laevis tadpoles immobilized with 33 μM 1-AMA for 1 h in pond water. Images of Xenopus head show 1-AMA localization within the brain, spinal cord, and olfactory system. (Left) Fluorescence image. (Center) Transmitted light image. (Right) Overlay, with labeled olfactory mucosa (OM), olfactory neuron (ON), olfactory bulb (OB), forebrain (FB), midbrain (MB), and hindbrain (HB). Sample was excited at 488 nm and emission collected from 515 to 550 nm.
Fig. 8.
Fig. 8.
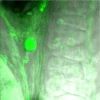
Confocal micrograph of a neuronal cell (left of image) within the brain of an albino stage 45–50 X. laevis tadpole immobilized with 33 μM 1-AMA for 1 h in pond water. This higher magnification image shows subcellular localization of 1-AMA (green fluorescence overlaid on transmitted light image).

References

    1. Eagle CC, Davis NJ. Report of the anaesthetic mortality committee of Western Australia 1990–1995. Anaesth Intensive Care. 1997;25:51–59. - PubMed
    1. Warden JC, Horan BF. Deaths attributed to anaesthesia in New South Wales, 1984–1990. Anaesth Intensive Care. 1996;24:66–73. - PubMed
    1. Dodds C, Allison J. Postoperative cognitive deficit in the elderly surgical patient. Br J Anaesth. 1998;81:449–462. - PubMed
    1. Moller JT, et al. Long-term postoperative cognitive dysfunction in the elderly: ISPOCD1 study. Lancet. 1998;351:857–861. - PubMed
    1. Parikh SS, Chung F. Postoperative delirium in the elderly. Anesth Analg. 1995;80:1223–1332. - PubMed

Publication types

MeSH terms