. 2009 Apr 21;106(16):6784-9.
doi: 10.1073/pnas.0902018106. Epub 2009 Apr 3.

H2-K(b) and H2-D(b) regulate cerebellar long-term depression and limit motor learning

Affiliations

H2-K(b) and H2-D(b) regulate cerebellar long-term depression and limit motor learning

Michael J McConnell et al. Proc Natl Acad Sci U S A. .

Abstract

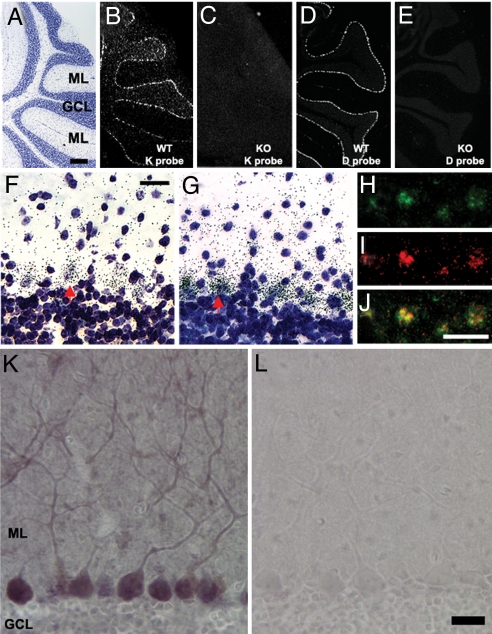
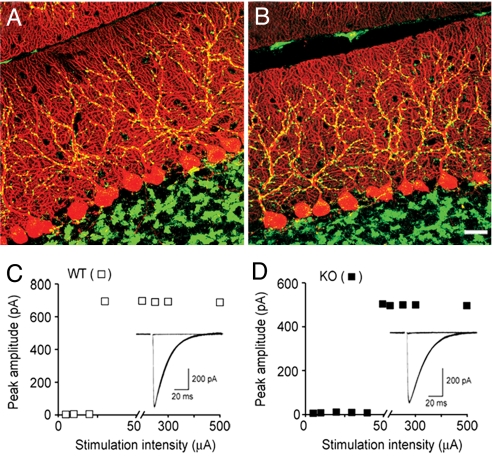
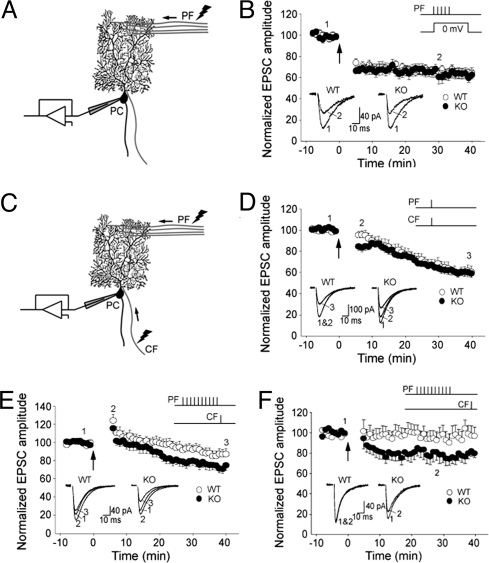
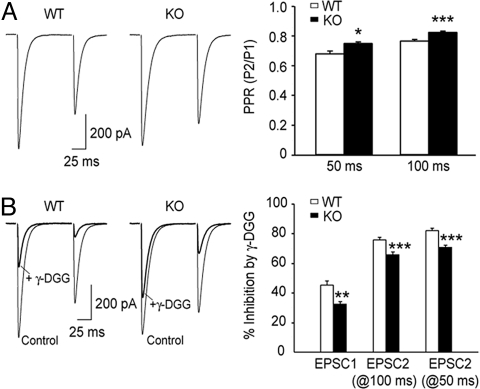
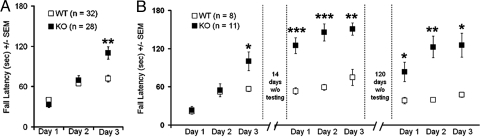
There are more than 50 class I MHC (MHCI) molecules in the mouse genome, some of which are now known to be expressed in neurons; however, the role of classical MHCI molecules in synaptic plasticity is unknown. We report that the classical MHCI molecules, H2-K(b) and H2-D(b), are co-expressed by Purkinje cells (PCs). In the cerebellum of mice deficient for both H2-K(b) and H2-D(b) (K(b)D(b-/-)), there is a lower threshold for induction of long-term depression (LTD) at parallel fiber to PC synapses. This change may be a result of additional glutamate release observed at K(b)D(b-/-) CF to PC synapses, which are thought to "train" the cerebellar circuit. A behavioral correlate of cerebellar LTD is motor learning; acquisition and retention of a Rotarod behavioral task is significantly better in K(b)D(b-/-) mice than in WT cohorts. These physiological and behavioral phenotypes in K(b)D(b-/-) mice reveal a surprising role for classical MHCI molecules in synaptic plasticity and motor learning.


Conflict of interest statement

The authors declare no conflict of interest.

Figures

Fig. 1.
Fig. 1.
H2-Kb and H2-Db are co-expressed in Purkinje neurons. (A) Cresyl violet staining (sagittal section at level of cerebellar vermis in adult mouse) shows lobules VI to VIII. The PC layer is located at interface of granule cell layer (GCL) and the molecular layer (ML). (Scale bar, 400 μm for A–E.) (B) Hybridization pattern obtained with H2-Kb riboprobe indicates expression in PC layer (isotopic ISH viewed with dark-field optics). (C) No hybridization of H2-Kb riboprobe is observed in KbDb−/− cerebellum. (D) Hybridization pattern obtained with H2-Db riboprobe indicates expression of H2-Db in PC layer. (E) No hybridization of H2-Db riboprobe is observed in KbDb−/− cerebellum. (F and G) Bright-field images (magnification, ×40) of cresyl violet-counterstained sections show dense H2-Kb (F) or H2-Db (G) riboprobe hybridization (small black dots are silver grains) around large pale nuclei in the PC layer (e.g., red arrow). (Scale bar, 20 μm.) (H-J) FISH for H2-Kb or H2-Db: fluorescent micrographs of hapten-labeled H2-Kb riboprobe (H, green) or H2-Db riboprobe (I, red) in PC layer; (J) merged image of H and I shows co-localization (yellow) of H2-Kb and H2-Db riboprobes. (Scale bar, 20 μm.) (K and L) Immunochemistry detects MHCI protein in PC dendrites and throughout the ML (K) but not in IgG-treated control sections (L). (Scale bar, 20 μm.)
Fig. 2.
Fig. 2.
Developmental regression of CF axons is normal in KbDb−/− mice. (A and B) PCs are immunostained for calbindin (red) and CF synapses are immunostained for vGluT2 (green) in representative confocal image stacks from postnatal d 21 to 23 WT (A) and KbDb−/− (B) cerebellum. (Scale bar, 20 μm.) (C) Whole-cell voltage-clamp recordings of CF EPSCs from a WT PC of a postnatal d 19 mouse show innervation by a single CF, and corresponding plots of EPSC peak amplitude as a function of stimulus intensity. (D) Representative traces and corresponding peak amplitude plots from a postnatal d 21 KbDb−/− PC show single CF innervation. (Holding potential, −15 mV.)
Fig. 3.
Fig. 3.
LTD at PF-PC synapses has lower induction threshold in KbDb−/− mice. (A) Diagram shows the recording configuration for B, where PC depolarization is paired with PF stimulation. (B) LTD of PF EPSCs can be induced and can reach a similar level in WT (n = 13) and KbDb−/− (n = 12) cells (P = 0.768 at 30 min post-induction) by pairing presynaptic PF stimulation trains (5 stimuli at 100 Hz) with postsynaptic depolarization (to 0 mV; 100 ms) every 15 sec for 5 min, in voltage-clamp mode using cesium-based internal solution. (C) Diagram showing the recording configuration for induction protocols in DF, where both CF and PF are stimulated. (D) LTD induced in KbDb−/− (n = 11) and WT (n = 13) cells (P < 0.05 at 6, 7, and 8 min) by conjunctional PF and CF activation at 1 Hz for 5 min, in current-clamp mode (at approximately −70 mV) using potassium-based internal solution. (E) LTD induced in KbDb−/− (n = 14) and WT (n = 13) cells (P < 0.05 at 30 min) by pairing presynaptic PF stimulation trains (10 stimuli at 100 Hz) with single CF activation (10 ms following PF train) every 15 sec for a total of 30 times, in current-clamp mode (at approximately −70 mV) using potassium-based internal solution. Recordings were made at room temperature. (F) LTD was induced in KbDb−/− (n = 13) and WT (n = 14) cells (P < 0.05 at 30 min post-induction) by pairing presynaptic PF stimulation trains (10 stimuli at 100 Hz) with single CF activation (50 ms following PF train) at 0.1 Hz for 5 min, in current-clamp mode (at approximately −70 mV) using potassium-based internal solution. Recordings were made at 31 °C to 33 °C. Bar graphs in B, D–F (Upper Insets) indicate the specific induction protocols. Arrows indicate the starting points of the ∼5 min inductions. Traces (Lower Inset) show example averaged EPSCs (8–12 consecutive responses) taken at the times indicated by the numbers on the graphs.
Fig. 4.
Fig. 4.
CF EPSCs have reduced paired-pulse depression and decreased sensitivity to γ-DGG in KbDb−/− mice. (A) Example traces of paired CF EPSCs from a WT and a KbDb−/− mouse, and grouped data show the mean PPR (i.e., peak amplitude of EPSC2/EPSC1; P2/P1) at 50 ms (n = 8 WT cells; n = 11 KbDb−/− cells) and 100 ms inter-stimulus intervals (ISIs; n = 11 WT cells; n = 16 KbDb−/− cells) in the 2 genotypes (at 50-ms ISI: WT, 0.68 ± 0.02; KbDb−/−, 0.75 ± 0.01; at 100-ms ISI: WT, 0.767 ± 0.009; KbDb−/−, 0.826 ± 0.008); *P < 0.05; ***P < 0.001. CF EPSCs recorded under voltage-clamp mode at the holding potential of −10 mV were not significantly different from WT control animals (Table S1). (B) Example traces of CF EPSCs recorded in the absence and presence of 2 mM γ-DGG, and grouped data show mean percentage inhibition of peak amplitude in the 2 genotypes (n = 8 WT cells; EPSC1 = 45.3% ± 2.8%; EPSC2 at 100-ms ISI, 75.8% ± 1.7%; EPSC2 at 50 ms ISI, 82.1% ± 1.5%; n = 11 KbDb−/− cells; EPSC1, 32.5% ± 1.5%; EPSC2 at 100 ms ISI, 65.9% ± 1.7%; EPSC2 at 50 ms ISI, 70.9% ± 1.3%). **, P < 0.01. Holding potential was −10 mV.
Fig. 5.
Fig. 5.
KbDb−/− mice outperform WT cohorts on the Rotarod behavioral task. (A) Average Rotarod performance on 3 consecutive days (x axis) is plotted on the y axis for WT (white squares) and KbDb−/− (black squares) mice. **, P < 0.005. (B) Average Rotarod performance during three 3-day periods (x axis) is plotted on the y axis for WT (white squares) and KbDb−/− (black squares) mice. Fourteen days elapsed between the first and second 3-day periods, 120 d elapsed between the second and third 3-day periods. *, P < 0.05; **, P < 0.005; ***, P = 0.0005. Error bars indicate the SEM on all graphs.

References

    1. Lefranc MP. IMGT, the international ImMunoGeneTics database. Nucleic Acids Res. 2003;31:307–310. - PMC - PubMed
    1. Duncan WR, Wakeland EK, Klein J. Heterozygosity of H-2 loci in wild mice. Nature. 1979;281:603–605. - PubMed
    1. Corriveau RA, Huh GS, Shatz CJ. Regulation of class I MHC gene expression in the developing and mature CNS by neural activity. Neuron. 1998;21:505–520. - PubMed
    1. Huh GS, et al. Functional requirement for class I MHC in CNS development and plasticity. Science. 2000;290:2155–2159. - PMC - PubMed
    1. Linda H, Hammarberg H, Piehl F, Khademi M, Olsson T. Expression of MHC class I heavy chain and beta2-microglobulin in rat brainstem motoneurons and nigral dopaminergic neurons. J Neuroimmunol. 1999;101:76–86. - PubMed

Publication types

Substances