. 2009 Apr 21;106(16):6477-82.
doi: 10.1073/pnas.0811091106. Epub 2009 Apr 3.

Linking high-resolution metabolic flux phenotypes and transcriptional regulation in yeast modulated by the global regulator Gcn4p

Affiliations

Linking high-resolution metabolic flux phenotypes and transcriptional regulation in yeast modulated by the global regulator Gcn4p

Joel F Moxley et al. Proc Natl Acad Sci U S A. .

Abstract

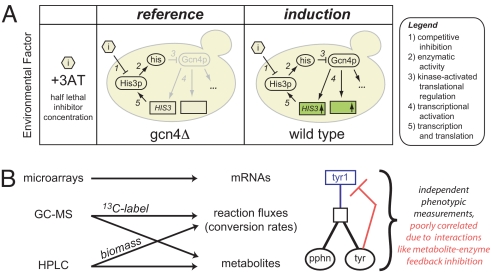
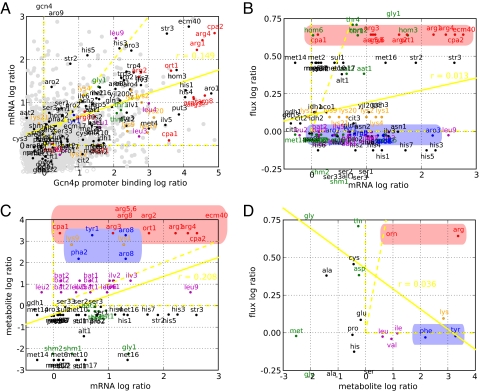
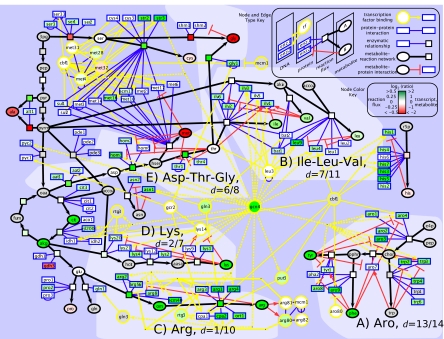
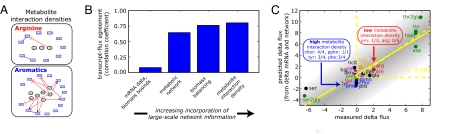
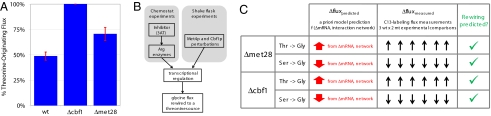
Genome sequencing dramatically increased our ability to understand cellular response to perturbation. Integrating system-wide measurements such as gene expression with networks of protein-protein interactions and transcription factor binding revealed critical insights into cellular behavior. However, the potential of systems biology approaches is limited by difficulties in integrating metabolic measurements across the functional levels of the cell despite their being most closely linked to cellular phenotype. To address this limitation, we developed a model-based approach to correlate mRNA and metabolic flux data that combines information from both interaction network models and flux determination models. We started by quantifying 5,764 mRNAs, 54 metabolites, and 83 experimental (13)C-based reaction fluxes in continuous cultures of yeast under stress in the absence or presence of global regulator Gcn4p. Although mRNA expression alone did not directly predict metabolic response, this correlation improved through incorporating a network-based model of amino acid biosynthesis (from r = 0.07 to 0.80 for mRNA-flux agreement). The model provides evidence of general biological principles: rewiring of metabolic flux (i.e., use of different reaction pathways) by transcriptional regulation and metabolite interaction density (i.e., level of pairwise metabolite-protein interactions) as a key biosynthetic control determinant. Furthermore, this model predicted flux rewiring in studies of follow-on transcriptional regulators that were experimentally validated with additional (13)C-based flux measurements. As a first step in linking metabolic control and genetic regulatory networks, this model underscores the importance of integrating diverse data types in large-scale cellular models. We anticipate that an integrated approach focusing on metabolic measurements will facilitate construction of more realistic models of cellular regulation for understanding diseases and constructing strains for industrial applications.


Conflict of interest statement

The authors declare no conflict of interest.

Figures

Fig. 1.
Fig. 1.
Experimental design and measurement strategy. (A) Analyzing the Gcn4p-dependent stress response in a controlled-growth chemostat environment. Wild-type S288C and an isogenic gcn4Δ derivative were cultured in a glucose-limited chemostat diluted at 0.10 h−1 (416 min per doubling) in unsupplemented YNB minimal media regulated to 5 +/− 0.1 pH. Titrated histidine biosynthesis inhibitor levels (10 and 0.1 mM, respectively, of 3-amino-1,2,4-triazole or 3AT) created histidine near starvation (Fig. S1), which causes Gcn4p translational activation and transcriptional activation of hundreds of targets in the wild type (+Gcn4p). Through this modulation of the inhibitor (3AT) concentration, both wild-type and gcn4Δ cultures were grown at the same specific growth rate (0.10 h−1) and achieved similar cell densities and production rates of ethanol and CO2 (Table S3). (B) Multitiered measurement strategy for analyzing large-scale network perturbations. We used microarrays, GC-MS, and HPLC to measure mRNAs, fluxes, and metabolites (see text and SI Text for further detail). These independent measurements give a broad view of the Gcn4p stress response and help to characterize network effects, such as metabolite interaction densities.
Fig. 2.
Fig. 2.
Pairwise comparisons of changes often reveal poor correlation in Gcn4p binding, mRNA, flux, and end product metabolite. Induction ratios for the measurements indicated on the axes correspond to Fig. 1. (A) Ratios of mRNAs (measurements described in text) and Gcn4p binding at the upstream promoter under starvation measured with ChIP arrays as described by Harbison, et al. (3) are scattered. As purely Gcn4p-regulated, CPA2 (Upper Right) illustrates a general observation: Stronger binding often leads to increased transcriptional activation. For other genes, the binding relationship gives insight to its transcriptional control and identifies genes (i) bound yet not activated (>2 log2 bound, <0.5 log2 expressed) and (ii) activated yet not bound (<1 log2 bound, >1 log2 expressed). The first class includes genes encoding transcription factors Met4p, Leu3p, and Lys14p, which likely require coactivators, and CPA1, which likely undergoes a uORF-mediated activation of mRNA decay (a metabolite-RNA interaction) (32, 33) by 10-fold increase in free arginine. The second class of genes includes ARO9 that likely have indirect mechanisms of transcriptional activation, for instance, by Aro80p in response to the 2- and 3-fold increases in free phenylalanine (34). (B–D) Log ratios for the mRNA, reaction flux, and metabolite measurements described in the text are associated by pathway and labeled. Arginine and aromatic data, which differ in metabolite interaction densities, are highlighted in red and blue, respectively. Yellow dotted lines highlight the positive x axis, y axis, and diagonal, and the yellow solid line represents the least squares fit of the data. Data points outside the axes were placed at the periphery. (B) Despite similar transcriptional activations, flux measurements diverge for arginine (in red, increased) and aromatic (in blue, invariant) pathways. Generally, transcriptional activation is insufficient in predicting flux activation. (C and D) Free phenylalanine and tyrosine rise 2- and 3- fold upon transcriptional activation, yet aromatic fluxes remains invariant likely because increased product levels modulate pathway activity through a high density of feedback metabolite-enzyme interactions. Overall, a variety of posttranscriptional control (e.g., metabolite interaction density) mechanisms simultaneously modulating pathways confound an effort to correlate mRNA, flux, and metabolite changes.
Fig. 3.
Fig. 3.
Integrated perspective of a large-scale network perturbation on amino acid biosynthesis. The central GCN4 node anchors a biomolecular gene/protein network expanded to include reactions and metabolites. The network contains condition-specific transcription factor binding, protein–protein binding, enzyme-reaction, reaction-metabolite, and metabolite-protein feedback edges (see node type and edge key). High metabolite interaction density is evident in A, B, and E. The dotted yellow edges emanating from the GCN4 node indicate an interaction found only in the wild type condition (i.e., not in gcn4Δ) Measurement ratios of wild type relative to gcn4Δ were visualized with a log2 colorbar (see node color key), and gray coloring indicates the lack of a measurement for that node. Findings for individual pathways are discussed in the text.
Fig. 4.
Fig. 4.
Incorporating large-scale biomolecular networks improve flux phenotype understanding. (A) Metabolite interaction densities are illustrated for arginine and aromatics biosythesis. (B) Changes in mRNA measurements were used to predict flux changes as described in the text and SI Text. By adding the statistically verified reaction network, biomass efflux bounds, and metabolite interaction density, the predicted fluxes from mRNA better matched measured fluxes with a correlation coefficient value of 0.80 relative to 0.07 corresponding to the initial assumption set (see SI Appendix, section 3). (C) Measured delta flux for individual reactions is labeled by end product metabolite and plotted versus the flux predicted from mRNA measurements and the 2 parameter model. Notably, adding metabolite interaction densities discriminates arginine and aromatic pathways to predict arginine's up-regulated flux. Without the model incorporating metabolite interaction densities, aromatic pathways would have been wrongly predicted to increase in flux.
Fig. 5.
Fig. 5.
Observations in glycine flux rewiring demonstrate a biological principle and validate the predictive network model. (A) Additional transcriptional regulatory perturbations drive a rewiring in glycine flux. Knockout strains for transcriptional regulators in the vicinity of glycine biosynthesis (met28Δ, cbf1Δ, met31Δ, and met32Δ) were constructed, mRNA levels were measured, and biosynthetic fluxes were determined for the 2 strains (met28Δ and cbf1Δ) that displayed significant transcriptional changes. The results for the percentage of threonine-originating glycine flux are displayed in the first panel. Similar to the previous Gcn4p-induced stress response data, we observe a rewiring of glycine flux away from serine precursor in both the met28Δ and cbf1Δ cultures. (B) Convergent rewiring of glycine flux. In both chemostat and shake flask experiments, transcriptional regulatory networks drives a rewiring of glycine flux to a threonine source. (C) The predictive model from Gcn4 experiments uses mRNA changes and the interaction network correctly identified flux rewiring in knockout experiments. mRNA changes from the met28Δ and cbf1Δ knockout strains were input to the existing predictive flux model to assess glycine flux rewiring. For both knockout mRNA profiles, the glycine flux was predicted to be rewired from a serine precursor to threonine. The experimentally measured flux changes of the serine and glycine (displayed in A) verify the prediction of this observed rewiring.

References

    1. Uetz P, et al. A comprehensive analysis of protein–protein interactions in Saccharomyces cerevisiae. Nature. 2000;403:623–627. - PubMed
    1. Lee TI, et al. Transcriptional regulatory networks in Saccharomyces cerevisiae. Science. 2002;298:799–804. - PubMed
    1. Harbison CT, et al. Transcriptional regulatory code of a eukaryotic genome. Nature. 2004;431:99–104. - PMC - PubMed
    1. Ideker T, et al. Integrated genomic and proteomic analyses of a systematically perturbed metabolic network. Science. 2001;292:929–934. - PubMed
    1. Ideker T, Ozier O, Schwikowski B, Siegel AF. Discovering regulatory and signalling circuits in molecular interaction networks. Bioinformatics. 2002;18(Suppl 1):S233–240. - PubMed

Publication types

MeSH terms