

In vivo monitoring of angiogenesis inhibitory treatment effects by dynamic contrast-enhanced computed tomography in a xenograft tumor model
- PMID: 19346961
- PMCID: PMC4115801
- DOI: 10.1097/RLI.0b013e31819f1b60
In vivo monitoring of angiogenesis inhibitory treatment effects by dynamic contrast-enhanced computed tomography in a xenograft tumor model
Abstract
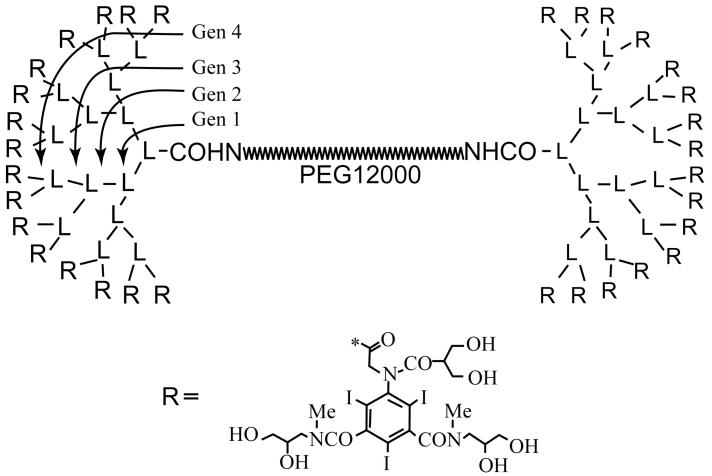
Rationale and objectives: To evaluate the potential of dynamic CT enhanced by iohexol or a novel macromolecular contrast agent, PEG12000-Gen4-triiodo, to monitor microvascular changes in tumors treated with the angiogenesis inhibitor bevacizumab.
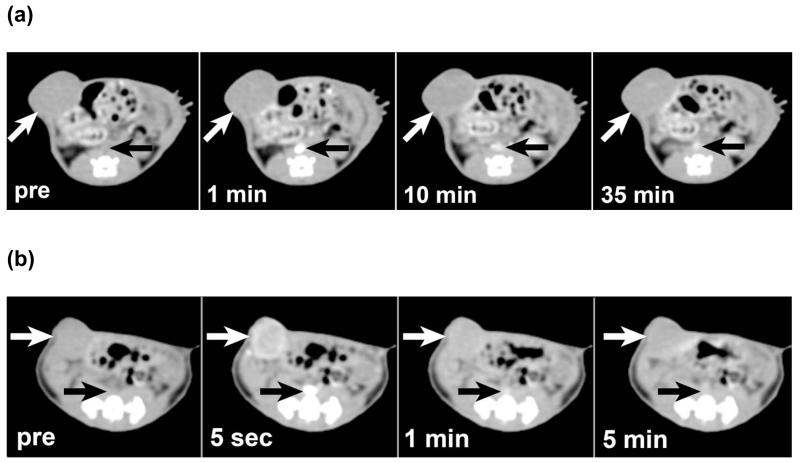
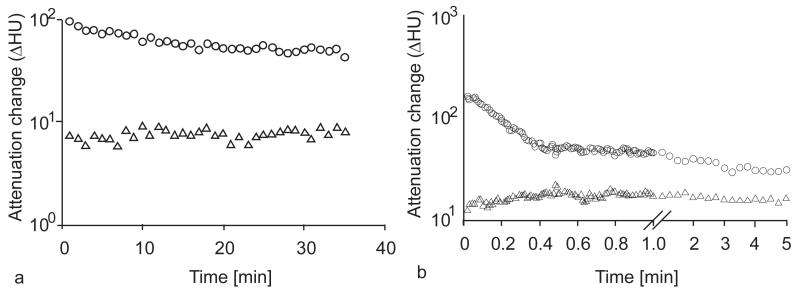
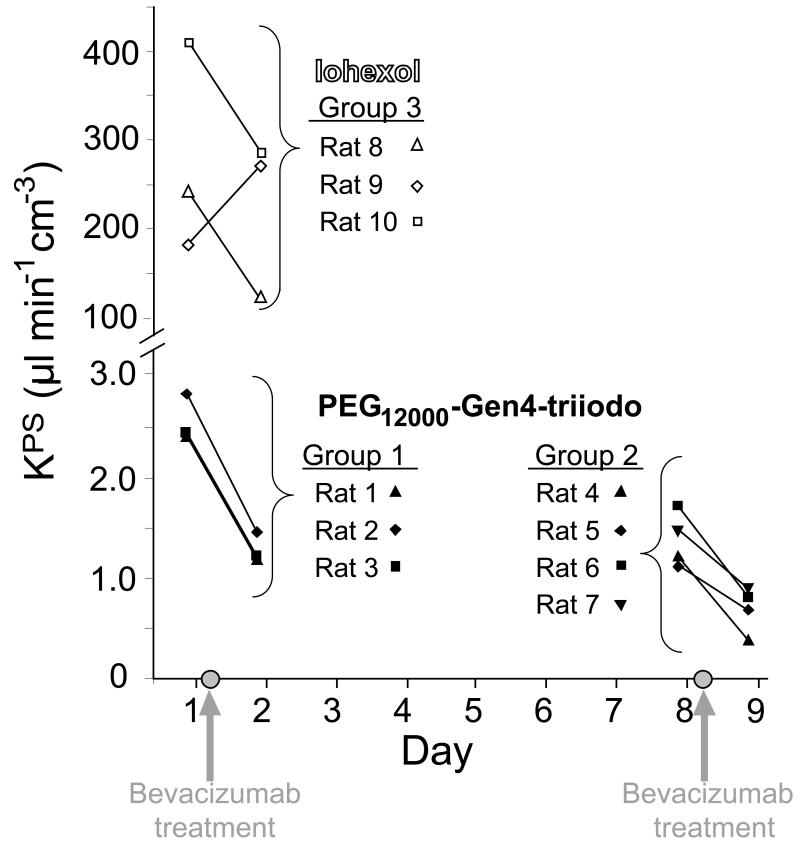
Materials and methods: Ten female nude rats with MDA-MB 435 xenograft tumors were treated with 1 mg intraperitoneal bevacizumab when tumors reached 1 cm diameter and, for 4 rats, treated again 7 days later. Just before and 24 hours after the first injection of anti-VEGF antibody, the tumors were imaged by dynamic CT scans enhanced with PEG12000-Gen4-triiodo (n = 3 rats) or iohexol (n = 3 rats). The other 4 rats underwent dynamic CT scans enhanced with PEG12000-Gen4-triiodo just before and 24 hours after the second injection of anti-VEGF antibody. Microvascular leakiness (K(PS)) was calculated for the tumors using a 2-compartment tissue model.
Results: PEG12000-Gen4-triiodo-enhanced CT scans showed progressive reductions in K(PS) from day 1 to 2 to 9 (from 2.55 to 1.27 to 0.69 microL min(-1) cm(-3), respectively, P < 0.005 for each comparison of day 1-2 and day 2-9). No significant difference was seen in the K(PS) estimates derived from iohexol-enhanced CT scans obtained before or after treatment (276 vs. 223.8 microL min(-1) cm(-3), respectively, P = 0.54). The microvascular leak (K(PS)) was significantly larger for iohexol than for PEG12000-Gen4-triiodo-enhanced CT, P < 0.05.
Conclusion: Dynamic macromolecular contrast-enhanced CT can be used to monitor serial decreases in tumor microvessel leakiness induced by repeated doses of an angiogenesis inhibitor drug.
Figures
Similar articles
-
Initial computed tomography imaging experience using a new macromolecular iodinated contrast medium in experimental breast cancer.Invest Radiol. 2005 Sep;40(9):614-20. doi: 10.1097/01.rli.0000174477.11541.ce. Invest Radiol. 2005. PMID: 16118555
-
Evaluation of a novel macromolecular cascade-polymer contrast medium for dynamic contrast-enhanced MRI monitoring of antiangiogenic bevacizumab therapy in a human melanoma model.Acad Radiol. 2013 Oct;20(10):1256-63. doi: 10.1016/j.acra.2013.07.010. Acad Radiol. 2013. PMID: 24029057 Free PMC article.
-
[Effects of MRI-assayed microvascular permeability on the accumulation of vinorelbine in xenograft tumors].Rofo. 2010 Feb;182(2):133-9. doi: 10.1055/s-0028-1109753. Epub 2009 Oct 27. Rofo. 2010. PMID: 19862658 German.
-
Monoclonal antibodies targeting vascular endothelial growth factor: current status and future challenges in cancer therapy.BioDrugs. 2009;23(5):289-304. doi: 10.2165/11317600-000000000-00000. BioDrugs. 2009. PMID: 19754219 Review.
-
Bevacizumab in the treatment of metastatic breast cancer.Oncology (Williston Park). 2009 Apr 15;23(4):327-32. Oncology (Williston Park). 2009. PMID: 19476261 Review.
Cited by
-
Small, Long Blood Half-Life Iodine Nanoparticle for Vascular and Tumor Imaging.Sci Rep. 2018 Sep 14;8(1):13803. doi: 10.1038/s41598-018-31940-2. Sci Rep. 2018. PMID: 30218059 Free PMC article.
-
Reliability assessment of CT enhancement rate and extracellular volume in liver fibrosis prediction.BMC Gastroenterol. 2025 Feb 21;25(1):101. doi: 10.1186/s12876-025-03678-5. BMC Gastroenterol. 2025. PMID: 39984822 Free PMC article.
-
Opportunities for new CT contrast agents to maximize the diagnostic potential of emerging spectral CT technologies.Adv Drug Deliv Rev. 2017 Apr;113:201-222. doi: 10.1016/j.addr.2016.09.001. Epub 2016 Sep 9. Adv Drug Deliv Rev. 2017. PMID: 27620496 Free PMC article. Review.
-
X-ray-computed tomography contrast agents.Chem Rev. 2013 Mar 13;113(3):1641-66. doi: 10.1021/cr200358s. Epub 2012 Dec 5. Chem Rev. 2013. PMID: 23210836 Free PMC article. Review. No abstract available.
-
Assessment of acute antivascular effects of vandetanib with high-resolution dynamic contrast-enhanced computed tomographic imaging in a human colon tumor xenograft model in the nude rat.Neoplasia. 2010 Sep;12(9):697-707. doi: 10.1593/neo.10292. Neoplasia. 2010. PMID: 20824046 Free PMC article.
References
-
- Tabernero J. The role of VEGF and EGFR inhibition: implications for combining anti-VEGF and anti-EGFR agents. Mol Cancer Res. 2007;5:203–220. - PubMed
-
- Zalatnai A. Novel therapeutic approaches in the treatment of advanced pancreatic carcinoma. Cancer Treat Rev. 2007;33:289–298. - PubMed
-
- Zelnak AB, O’Regan RM. Targeting angiogenesis in advanced breast cancer. BioDrugs. 2007;21:209–214. - PubMed
-
- Lavisse S, Lejeune P, Rouffiac V, et al. Early quantitative evaluation of a tumor vasculature disruptive agent AVE8062 using dynamic contrast-enhanced ultrasonography. Invest Radiol. 2008;43:100–111. - PubMed
-
- Persigehl T, Matuszewski L, Kessler T, et al. Prediction of antiangiogenic treatment efficacy by iron oxide enhanced parametric magnetic resonance imaging. Invest Radiol. 2007;42:791–796. - PubMed
Publication types
MeSH terms
Substances
Grants and funding
LinkOut - more resources
Full Text Sources
Medical
Miscellaneous
