

doi: 10.1007/978-1-59745-447-6_5.
Approaches to determine expression of inflammatory cytokines
Affiliations
- PMID: 19347295
- PMCID: PMC2698024
- DOI: 10.1007/978-1-59745-447-6_5
Item in Clipboard
Approaches to determine expression of inflammatory cytokines
Methods Mol Biol.
2009.
Abstract
There is an increasing awareness of the role of inflammation in cancer. Immune responses can limit the growth of some tumors, but paradoxically, may promote the growth of others. Cytokines are critical mediators of both the innate and the adaptive immune responses. In this chapter, we will describe several methods for the detection of inflammatory cytokines. First, we will describe a protocol for quantification of cytokine mRNA by real-time quantitative PCR. In addition, we will describe detection of cytokine proteins by ELISA as well as by novel cytokine bead arrays. Finally, a method will be described for in situ detection of cytokine production by immunohistochemistry.
Figures
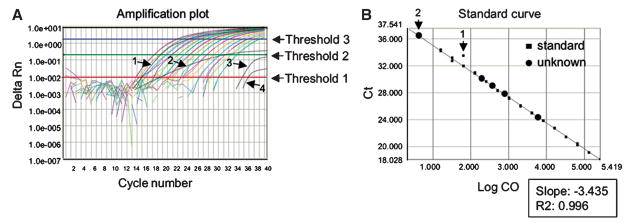
Real-time PCR plots. (A) Amplification plot. Fluorescence increase is shown as a function of cycle number. Delta Rn represents the normalized reporter (Rn) fluorescence intensities after subtraction of baseline intensities. Baseline cycles are those before a steady upward trend in fluorescence occurs. Generally, the baseline cycles are determined by a program software and need not be adjusted. This threshold is set automatically by program software, but sometimes, manual adjustments can improve data quality. The threshold must be set within the exponential phase of the curve, as that is the phase of the reaction when components are not limiting and close to a doubling of product occurs with each cycle. For this reason, it is easiest to plot the Delta Rn on a logarithmic scale, since this magnifies the exponential phase compared to a linear view. In this example, the threshold could be set a bit lower, such that it would include trace number 3. However, threshold 1 is set too low, because it fails to exclude nonspecific signal generated at the first four cycles of the reaction, when no specific product is present yet. Trace number 4 cannot reliably be included in the analysis, therefore. On the other hand, threshold 3 is set too high, as it no longer falls within the exponential phase. Reliable amplification curves all run parallel to one another and have similar shapes. Trace number 1 looks reliable, but trace number 2 cannot be trusted, because of its deviant shape. (B) Standard curve. The cycle at which a sample crossed the threshold (threshold cycle, Ct) is plotted against the starting concentration (on a logarithmic scale-Log CO). The slope of the standard curve (closed squares) is between 3.1 and 3.5, indicating almost perfect exponential kinetics of the PCR reaction and the reliability of the curve fit (R2) is high. The standard curve could still be improved by excluding standard sample number 2, which is a clear outlier. Measurements of most experimental samples (unknowns, closed circles) can be trusted, except for sample number 2, which falls outside the standard curve.
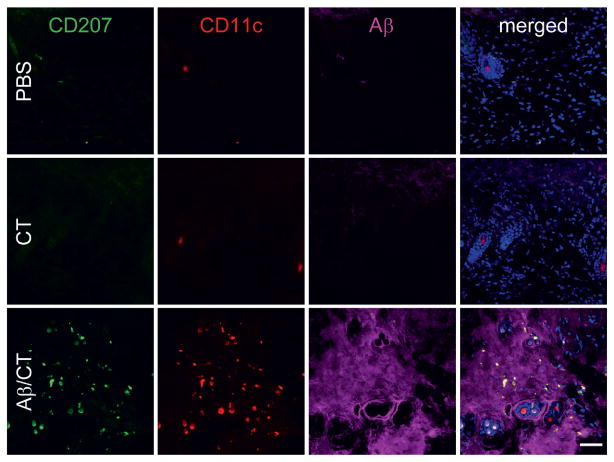
Skin confocal micrographs of a cytokine-like peptide (Aβ) and immune cell-surface markers after transcutaneous immunization. To characterize dermal immune responses to Aβ plus cholera toxin (Aβ/CT) transcutaneous (t.c.) immunization, skin tissues were prepared from nontransgenic C57BL/6 mice t.c.-immunized for 18 h with PBS (control, Top), CT alone (Middle), or Aβ/CT (Bottom) as indicated and then analyzed by laser scanning confocal microscopy with the indicated antibodies (antibody 4G8 was used to reveal Aβ). Note the presence of CD207 + CD11c+ Langerhans cells in Aβ-positive regions in the Aβ/CT t.c.-immunized group. DAPI (blue signal) was used as a nuclear counterstain in merged images shown to the right. (Scale bar: 50 μm.). This figure and figure legend was reproduced with permission from Proceedings of the National Academy of Sciences of the United States of America.
Similar articles
-
Molecular Determinants in Pig Semen: Verified Protocols for Cytokine Detection and Quantification.Methods Mol Biol. 2025;2897:611-626. doi: 10.1007/978-1-0716-4406-5_41. Methods Mol Biol. 2025. PMID: 40202664
-
Optimal kinetics for quantification of antigen-induced cytokines in human peripheral blood mononuclear cells by real-time PCR and by ELISA.J Immunol Methods. 2003 Oct 1;281(1-2):27-35. doi: 10.1016/s0022-1759(03)00267-9. J Immunol Methods. 2003. PMID: 14580879
-
Modulation of interleukin-1β-induced inflammatory responses by a synthetic cationic innate defence regulator peptide, IDR-1002, in synovial fibroblasts.Arthritis Res Ther. 2011 Aug 11;13(4):R129. doi: 10.1186/ar3440. Arthritis Res Ther. 2011. PMID: 21835002 Free PMC article.
-
A cytokine-mediated link between innate immunity, inflammation, and cancer.J Clin Invest. 2007 May;117(5):1175-83. doi: 10.1172/JCI31537. J Clin Invest. 2007. PMID: 17476347 Free PMC article. Review.
-
Cancer-related inflammation.J Clin Immunol. 2013 Jan;33 Suppl 1:S79-84. doi: 10.1007/s10875-012-9847-0. Epub 2012 Dec 9. J Clin Immunol. 2013. PMID: 23225204 Review.
Cited by
-
Effects of Chlorpyrifos on Serine Hydrolase Activities, Lipid Mediators, and Immune Responses in Lungs of Neonatal and Adult Mice.Chem Res Toxicol. 2021 Jun 21;34(6):1556-1571. doi: 10.1021/acs.chemrestox.0c00488. Epub 2021 Apr 26. Chem Res Toxicol. 2021. PMID: 33900070 Free PMC article.
-
Ultratrace level determination and quantitative analysis of kidney injury biomarkers in patient samples attained by zinc oxide nanorods.Nanoscale. 2016 Feb 28;8(8):4613-22. doi: 10.1039/c5nr08706f. Nanoscale. 2016. PMID: 26846189 Free PMC article.
-
Prolactin Attenuates Neuroinflammation in LPS-Activated SIM-A9 Microglial Cells by Inhibiting NF-κB Pathways Via ERK1/2.Cell Mol Neurobiol. 2022 Oct;42(7):2171-2186. doi: 10.1007/s10571-021-01087-2. Epub 2021 Apr 5. Cell Mol Neurobiol. 2022. PMID: 33821330 Free PMC article.
-
Aspartyl proteases in Candida glabrata are required for suppression of the host innate immune response.J Biol Chem. 2018 Apr 27;293(17):6410-6433. doi: 10.1074/jbc.M117.813741. Epub 2018 Feb 28. J Biol Chem. 2018. PMID: 29491142 Free PMC article.
-
Assessing biofilm inhibition and immunomodulatory activity of small amounts of synthetic host defense peptides synthesized using SPOT-array technology.Nat Protoc. 2021 Apr;16(4):1850-1870. doi: 10.1038/s41596-021-00500-w. Epub 2021 Apr 9. Nat Protoc. 2021. PMID: 33837303
References
-
- Bui JD, Schreiber RD. Cancer immunosurveillance, immunoediting and inflammation: independent or interdependent processes? Curr Opin Immunol. 2007;19:203–208. - PubMed
-
- Balkwill F, Charles KA, Mantovani A. Smoldering and polarized inflammation in the initiation and promotion of malignant disease. Cancer Cell. 2005;7:211–217. - PubMed
-
- de Visser KE, Eichten A, Coussens LM. Paradoxical roles of the immune system during cancer development. Nat Rev Cancer. 2006;6:24–37. - PubMed
-
- Le T, Leung L, Carroll WL, Schibler KR. Regulation of interleukin-10 gene expression: possible mechanisms accounting for its upregulation and for maturational differences in its expression by blood mononuclear cells. Blood. 1997;89:4112–4119. - PubMed
-
- Scheu S, Stetson DB, Reinhardt RL, Leber JH, Mohrs M, Locksley RM. Activation of the integrated stress response during T helper cell differentiation. Nat Immunol. 2006;7:644–651. - PubMed
Publication types
MeSH terms
Substances
Grants and funding
LinkOut - more resources
Full Text Sources
Other Literature Sources
