. 2009:486:151-65.
doi: 10.1007/978-1-60327-545-3_11.

High-content screening: flow cytometry analysis

Affiliations

High-content screening: flow cytometry analysis

Bruce S Edwards et al. Methods Mol Biol. 2009.

Abstract

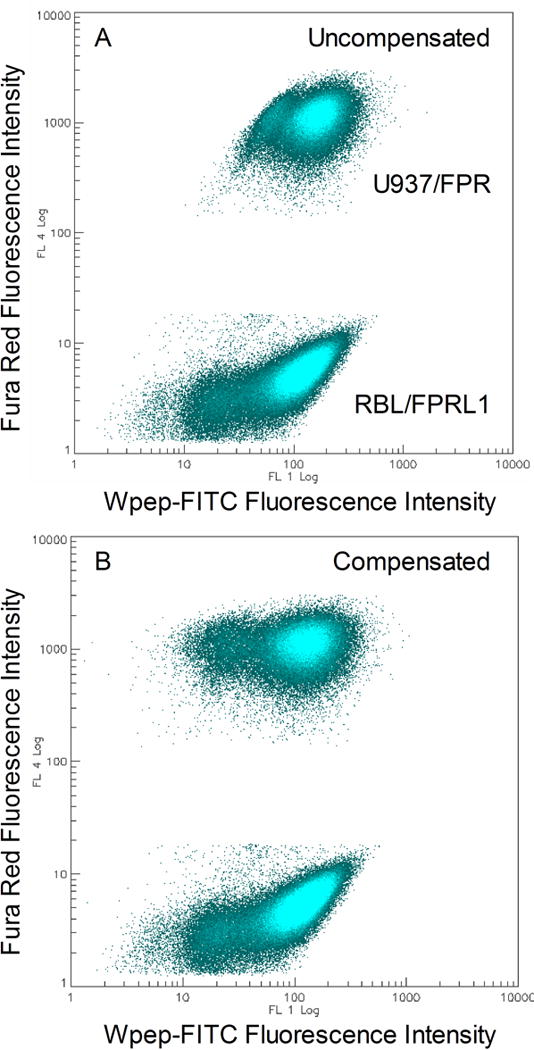
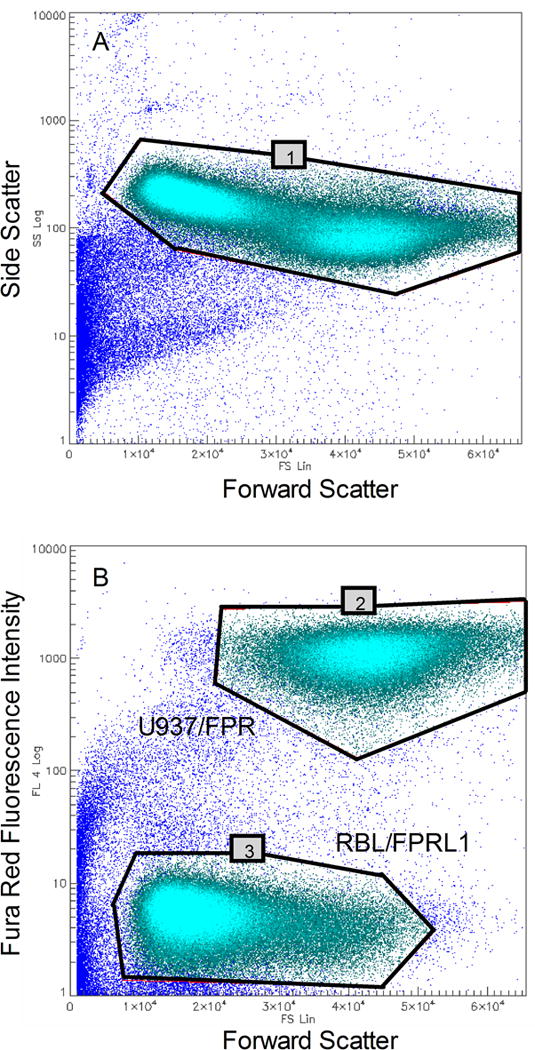
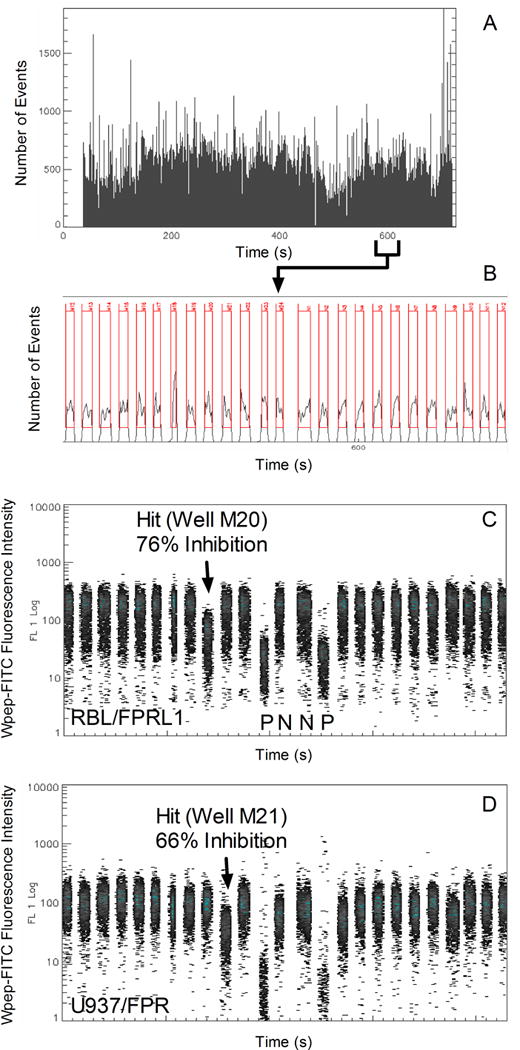
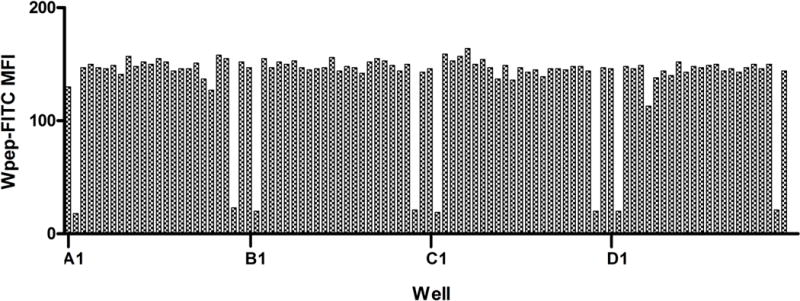
The HyperCyt high-throughput (HT) flow cytometry sampling platform uses a peristaltic pump, in combination with an autosampler, and a novel approach to data collection, to circumvent time-delay bottlenecks of conventional flow cytometry. This approach also dramatically reduces the amount of sample aspirated for each analysis, typically requiring ~2 microL per sample while making quantitative fluorescence measurements of 40 or more samples per minute with thousands to tens of thousands of cells in each sample. Here, we describe a simple robust screening assay that exploits the high-content measurement capabilities of the flow cytometer to simicroltaneously probe the binding of test compounds to two different receptors in a common assay volume, a duplex assay format. The ability of the flow cytometer to distinguish cell-bound from free fluorophore is also exploited to eliminate wash steps during assay setup. HT flow cytometry with this assay has allowed efficient screening of tens of thousands of small molecules from the NIH Small-Molecule Repository to identify selective ligands for two related G-protein-coupled receptors, the formylpeptide receptor and formylpeptide receptor-like 1.


Figures

Figure 1
Figure 1
Fluorescence compensation to correct for red fluorescence spillover into the green fluorescence detection channel. A. Uncompensated fluorescence data. B. Fluorescence profile after compensation. Approximately 3% of the signal detected in the red FL4 channel for each event was subtracted from the corresponding signal detected in the green FL1 channel. The plots represent combined data from all 384 wells.
Figure 2
Figure 2
Electronic gates required for analysis. A. A light scatter gate (gate 1) is constructed to exclude debris and non-viable cells from the analysis. B. Two additional gates are constructed on the basis of the color coding signals in the red fluorescence channel. One encloses red fluorescent U937/FPR cells (gate 2) and the other encloses unstained RBL/FPRL1 cells (gate 3). The plots represent combined data from all 384 wells.
Figure 3
Figure 3
Resolution and analysis of cells sampled from individual wells. A. Display of data from all 384 wells in the Time Bins Analysis window in which the numbers of events detected at 100 ms time intervals are plotted as a function of time. B. A zoomed-in view of data from 25 wells measured in the vicinity of the 600 s time point (boundaries indicated below the time axis in panel A). A software peak detection algorithm identified 384 sets of data and enclosed each in a separate rectangular analysis region or Time Bin. Data sets were segregated on the basis of time gaps in the data stream produced by the passage of air bubbles. The first set is from well M12 and the last from well N12. C. Green fluorescence data from RBL/FPRL1 cells (gate 3) in wells M12 to N12. The test compound in well M20 (arrow) caused a 75% inhibition of Wpep-FITC binding relative to fluorescence intensities measured in control wells. It did not detectably affect Wpep-FITC binding to U937/FPR cells in the same well (see panel D). Data from two positive control wells (P) and two negative control wells (N) are also indicated. D. Green fluorescence data from U937/FPR cells (gate 2) in wells M12 to N12. Well M21 contained a test compound that caused 66% inhibition of Wpep-FITC binding and no detectable effect on Wpep-FITC binding to RBL/FPRL1 cells in the same well (see panel C).
Figure 4
Figure 4
Repetitive fluorescence intensity pattern provides supplementary sample indexing information. Illustrated are green fluorescence data from the first 96 wells of a 384-well plate. Wells are sampled from left-to right (columns 1 to 24) one row at a time, starting with the top row (row A) and moving down. This results in a repetitive pattern of low median fluorescence intensity (MFI) signals marking the 2nd and 23rd wells of each row, the locations of the positive control samples. This information facilitates identification of a row in which an indexing error has occurred.

Similar articles

Cited by

References

    1. Kuckuck FW, Edwards BS, Sklar LA. Cytometry. 2001;44:83–90. - PubMed
    1. Ramirez S, Aiken CT, Andrzejewski B, Sklar LA, Edwards BS. Cytometry. 2003;53A:55–65. - PubMed
    1. Young SM, Bologa C, Prossnitz E, Oprea TI, Sklar LA, Edwards BS. J Biomol Screen. 2004;10:374–382. - PubMed
    1. Edwards BS, Bologa C, Young SM, Balakin KV, Prossnitz E, Savchuck NP, Sklar LA, Oprea TI. Mol Pharmacol. 2005;68:1301–1310. - PubMed
    1. Edwards BS, Young SM, Oprea TI, Bologa C, Prossnitz E, Sklar LA. Nat Protocols. 2006;1:59–66. - PubMed

Publication types

LinkOut - more resources