. 2009 Apr 6:10:147.
doi: 10.1186/1471-2164-10-147.

Early iron-deficiency-induced transcriptional changes in Arabidopsis roots as revealed by microarray analyses

Affiliations

Early iron-deficiency-induced transcriptional changes in Arabidopsis roots as revealed by microarray analyses

Thomas J Buckhout et al. BMC Genomics. .

Abstract

Background: Iron (Fe) is an essential nutrient in plants and animals, and Fe deficiency results in decreased vitality and performance. Due to limited bio-availability of Fe, plants have evolved sophisticated adaptive alterations in development, biochemistry and metabolism that are mainly regulated at the transcriptional level. We have investigated the early transcriptional response to Fe deficiency in roots of the model plant Arabidopsis, using a hydroponic system that permitted removal of Fe from the nutrient solution within seconds and transferring large numbers of plants with little or no mechanical damage to the root systems. We feel that this experimental approach offers significant advantages over previous and recent DNA microarray investigations of the Fe-deficiency response by increasing the resolution of the temporal response and by decreasing non-Fe deficiency-induced transcriptional changes, which are common in microarray analyses.

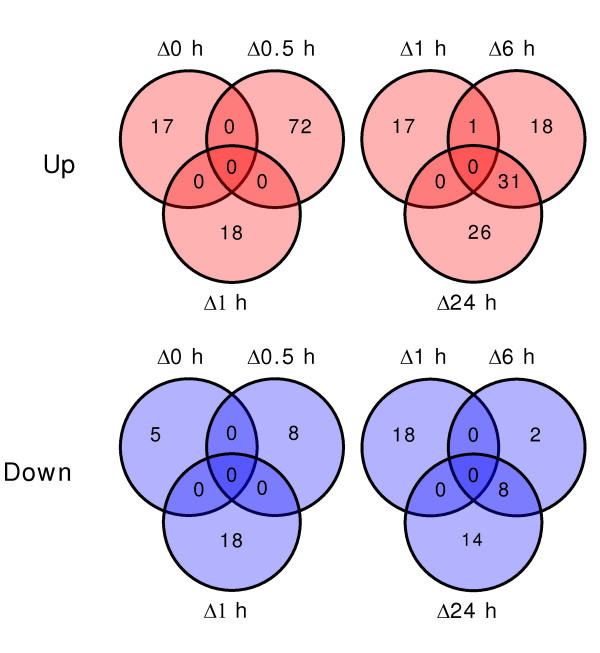
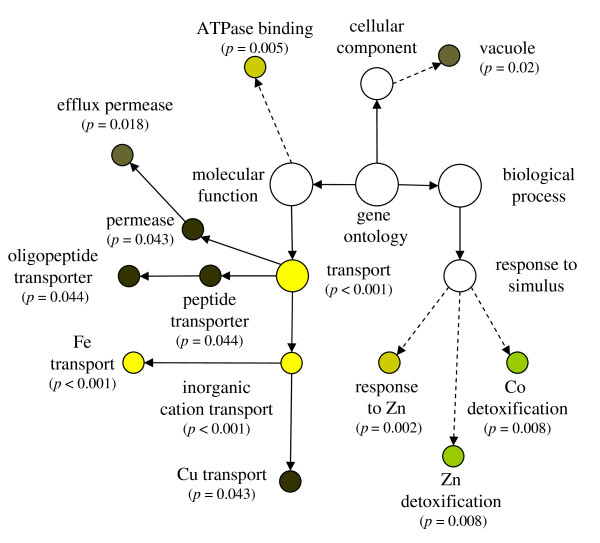
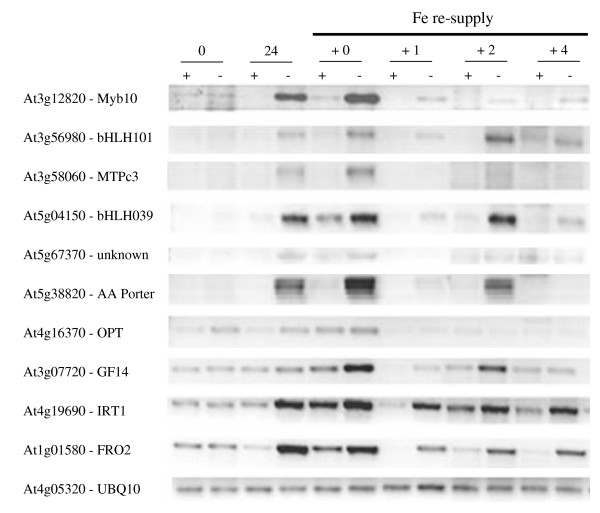
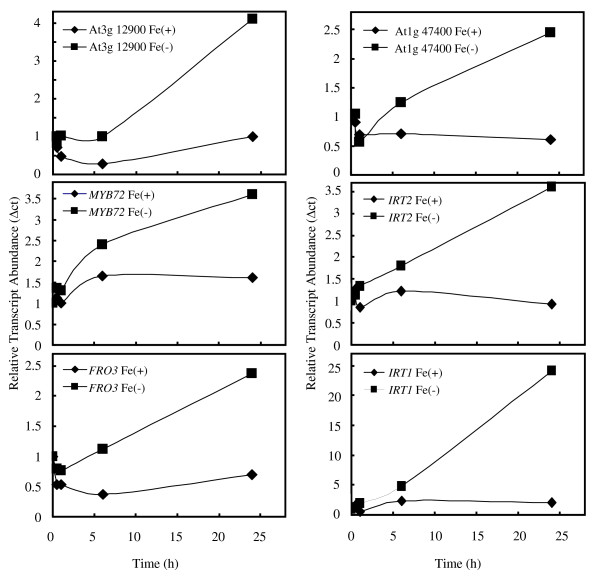
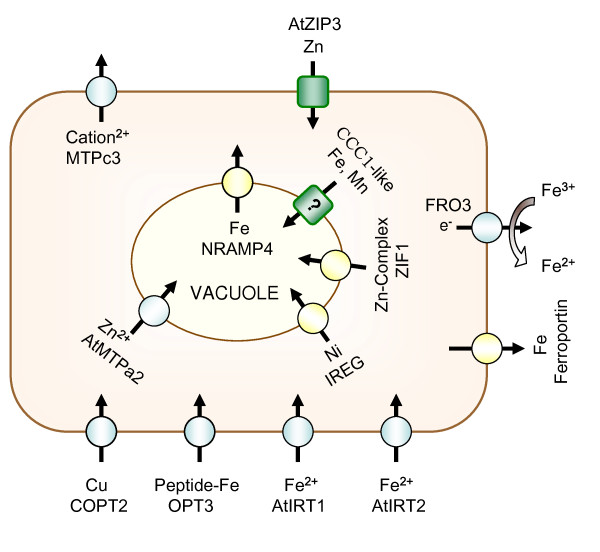
Results: The expression of sixty genes were changed after 6 h of Fe deficiency and 65% of these were found to overlap with a group of seventy-nine genes that were altered after 24 h. A disproportionally high number of transcripts encoding ion transport proteins were found, which function to increase the Fe concentration and decrease the zinc (Zn) concentration in the cytosol. Analysis of global changes in gene expression revealed that changes in Fe availability were associated with the differential expression of genes that encode transporters with presumed function in uptake and distribution of transition metals other than Fe. It appeared that under conditions of Fe deficiency, the capacity for Zn uptake increased, most probably the result of low specificity of the Fe transporter IRT1 that was induced upon Fe deficiency. The transcriptional regulation of several Zn transports under Fe deficiency led presumably to the homeostatic regulation of the cytosolic concentration of Zn and of other transition metal ions such as Mn to avoid toxicity.

Conclusion: The genomic information obtained from this study gives insights into the rapid transcriptional responses to Fe shortage in plants, and is important for understanding how changes in nutrient availability are translated into responses that help to avoid imbalances in ion distribution. We further identified rapidly induced or repressed genes with potential roles in perception and signaling during Fe deficiency which may aid in the elucidation of these processes.


Figures

Figure 1
Figure 1
Venn diagrams summarizing time- and Fe-dependent changes of transcript abundance in Arabidopsis roots. The intersections of the circles for the individual time points represent the number of genes whose transcript abundance with respect to the control treatments was increased (red, "up") or decreased (blue, "down"). For time-dependent and Fe-dependent changes, gene transcripts were tallied whose p-score was < 0.05.
Figure 2
Figure 2
The averaged response of clusters to Fe deficiency. The entire array dataset was subjected to a k-means cluster analysis, and the centroids of these clusters were plotted with respect to time (A). The misrepresentation of significantly expressed gene transcripts is reported below the figure (B). For this analysis, the total frequency of genes found in a cluster was compared to the transcript frequency in the 200 statistically most significant signals.
Figure 3
Figure 3
Heatmap analysis of changes in transcript abundance in Arabidopsis roots grown under Fe deficiency. The fine structure of clusters one and six were investigated. Changes in response to Fe deficiency with a p-value of < 0.05 were selected for analysis. In a detailed analysis, several transcripts that were grouped into cluster 4 by an analysis of all transcripts showed an overlap with cluster six. The overlapping members of cluster 4 are also shown in the figure.
Figure 4
Figure 4
Over representation of gene ontogeny categories (GO) in genes showing decreased abundance under Fe deficiency. The genes, taken from Table 2, were analyzed using BinGO [50] and corrected for false discovery rate using the method of Benjamini and Hochberg [51]. Dotted lines indicate intermediate categories that are not shown.
Figure 5
Figure 5
Over representation of gene ontogeny categories (GO) in genes showing increased abundance under Fe deficiency. The genes, taken from Table 3–4, were analyzed using BinGO [50] and corrected for false discovery rate using the method of Benjamini and Hochberg [51]. Dotted lines indicate intermediate categories that are not shown.
Figure 6
Figure 6
Semi-quantitative RT-PCR analysis of geneexpression. Plants were grown for 24 h with or without Fe and transferred to Fe-sufficient medium. Roots were harvested and analyzed by PCR as describe in the Materials and Methods. Nine genes were selected from Table 3 for analysis. RNA abundance in the different treatments was standardized using the ubiquitin 10 gene. The experiment was repeated once with similar results.
Figure 7
Figure 7
Real-time RT-PCR analysis of gene expression. Plants were transferred to either Fe-deficient or Fe-sufficient media and transcript abundance was monitored at times 0, 6 and 24 h following the transfer. Roots were harvested and analyzed by qRT-PCR as described in the Materials and Methods. Six genes were selected from Table 3 for analysis. RNA abundance in the different treatments was standardized using the α-tubulin (At5g19770) gene. The experiment was repeated twice with similar results.
Figure 8
Figure 8
Summary of the immediate changes in ion transport in response to Fe deficiency. Squares were used to depict transporters with decreased and circles transporters with increased abundances. Yellow symbols represent changes that were observed only after 24 h of Fe deficiency, whereas the grey symbols were observed at both 6 and 24 h. The genes encoding the proteins shown are: COPT2 (At3g46900, [41]), OPT3 (At4g16370, [34]), IRT1 (At4g19690, [9]), IRT2 (At4g19680, [32]), Ferroportin (At5g26820, [36]), FRO3 (At1g23020, [33]), ZIP3 (At2g32270, [43]), MTPc3 (At3g58060, [38]), MTPa2 (At3g58810, [39]), IREG2 (At5g03570, [42]), ZIF1 (At5g13740, [40]), CCC1-like (At3g25190 [30] and NRAMP4 (At5g67330, [35]). The subcellular localization has been experimentally demonstrated for COPT2, IRT1, MTPa2, IREG2 and NRAMP4. Localization of the other proteins is hypothetical and was assumed according to their predicted function.

References

    1. Marschner H. Mineral Nutrition of Higher Plants. 2. London: Academic Press Ltd; 1995.
    1. Römheld V, Marschner H. Evidence for a specific uptake system for iron phytosiderophres in roots of grasses. Plant Physiol. 1986;80:175–180. doi: 10.1104/pp.80.1.175. - DOI - PMC - PubMed
    1. Curie C, Briat JF. Iron transport and signaling in plants. Annu Rev Plant Biol. 2003;54:183–206. doi: 10.1146/annurev.arplant.54.031902.135018. - DOI - PubMed
    1. Robinson NJ, Procter CM, Connolly EL, Guerinot ML. A ferric-chelate reductase for iron uptake from soils. Nature. 1999;397:694–697. doi: 10.1038/17800. - DOI - PubMed
    1. Waters BM, Blevins DG, Eide DJ. Characterization of FRO1, a pea ferric-chelate reductase involved in root iron acquisition. Plant Physiol. 2002;129:85–94. doi: 10.1104/pp.010829. - DOI - PMC - PubMed

Publication types