. 2009 Apr 8;96(7):2589-603.
doi: 10.1016/j.bpj.2008.12.3951.

Macroscopic models of local field potentials and the apparent 1/f noise in brain activity

Affiliations

Macroscopic models of local field potentials and the apparent 1/f noise in brain activity

Claude Bédard et al. Biophys J. .

Abstract

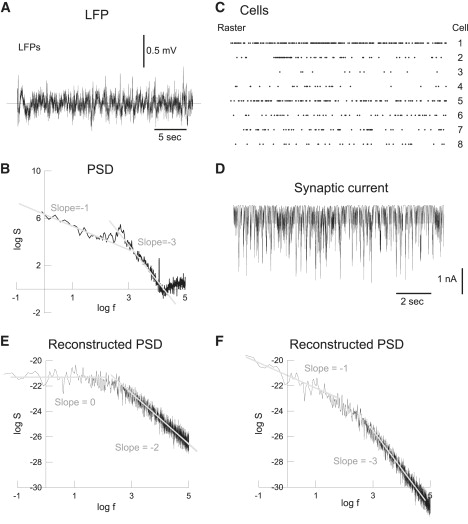
The power spectrum of local field potentials (LFPs) has been reported to scale as the inverse of the frequency, but the origin of this 1/f noise is at present unclear. Macroscopic measurements in cortical tissue demonstrated that electric conductivity (as well as permittivity) is frequency-dependent, while other measurements failed to evidence any dependence on frequency. In this article, we propose a model of the genesis of LFPs that accounts for the above data and contradictions. Starting from first principles (Maxwell equations), we introduce a macroscopic formalism in which macroscopic measurements are naturally incorporated, and also examine different physical causes for the frequency dependence. We suggest that ionic diffusion primes over electric field effects, and is responsible for the frequency dependence. This explains the contradictory observations, and also reproduces the 1/f power spectral structure of LFPs, as well as more complex frequency scaling. Finally, we suggest a measurement method to reveal the frequency dependence of current propagation in biological tissue, and which could be used to directly test the predictions of this formalism.


Figures

Figure 1
Figure 1
Illustration of the two main physical phenomena involved in the genesis of local field potentials. A given current source produces an electric field, which will tend to polarize the charged membranes around the source, as schematized on the top. The flow of ions across the membrane of the source will also involve ionic diffusion to reequilibrate the concentrations. This diffusion of ions will also be responsible for inducing currents in extracellular space. These two phenomena influence the frequency filtering and the genesis of LFP signals, as explored in this article.
Figure 2
Figure 2
Monopole and dipole arrangements of current sources. (A) Scheme of the extracellular medium containing a quasidipole (shaded) representing a pyramidal neuron, with soma and apical dendrite arranged vertically. (B) Illustration of one of the monopoles of the dipole. The extracellular space is represented by cellular processes of various size (circles) embedded in a conductive fluid. The dashed lines represent equipotential surfaces. The ab^ line illustrates the fact that the extracellular fluid is linearly connex.
Figure 3
Figure 3
Models of macroscopic extracellular conductivity compared to experimental measurements in cerebral cortex. The experimental data (labeled G) show the real part of the conductivity measured in cortical tissue by the experiments of Gabriel et al. (8). The curve labeled E represents the macroscopic conductivity calculated according to the effects of electric field in a nonreactive medium. The curve labeled D is the macroscopic conductivity due to ionic diffusion in a nonreactive medium. The curve labeled P shows the macroscopic conductivity calculated from a reactive medium with electric-field effects (polarization phenomena). The curve labeled DP shows the macroscopic conductivity in the full model, combining the effects of electric polarization and ionic diffusion. Every model was fit to the experimental data by using a least-square procedure, and the best fit is shown. The DP model's conductivity is given by Eq. 30 with K0 = 10.84, K1 = −19.29, K2 = 180.35, and K3 = 52.56. The experimental data (G) is the parametric Cole-Cole model (12), which was fit to the experimental measurements of Gabriel et al. (8). This fit is in agreement with experimental measurements for frequencies >10 Hz. No experimental measurements exist for frequencies <10 Hz, and the different curves show different predictions from the phenomenological model of Cole-Cole and these models.
Figure 4
Figure 4
Simulation of 1/f frequency scaling of LFPs during wakefulness. (A) LFP recording in the parietal cortex of an awake cat. (B) Power spectral density (PSD) of the LFP in log scale, showing two different scaling regions with a slope of −1 and −3, respectively. (C) Raster of eight simultaneously-recorded neurons in the same experiment as in panel A. (D) Synaptic current calculated by convolving the spike trains in panel C with exponentials (decay time constant of 10 ms). (E) PSD calculated from the synaptic current, shown two scaling regions of slope 0 and −2, respectively. (F) PSD calculated using a model including ionic diffusion (see text for details). The scaling regions are of slope −1 and −3, respectively, as in the experiments in panel B. Experimental data taken from Destexhe et al. (37); see also Bédard et al. (2) for details of the analysis in panels BD.
Figure 5
Figure 5
Simulation of more complex frequency scaling of LFPs during slow-wave sleep. (A) Similar LFP recording as in Fig. 4A (same experiment), but during slow-wave sleep. (B) Raster of eight simultaneously-recorded neurons in the same experiment as in panel A. The vertical shaded lines indicate concerted pauses of firing which presumably occur during the down states. (C) Synaptic current calculated by convolving the spike trains in panel B with exponentials (decay time constant of 10 ms). (D) Power spectral density (PSD) of the LFP in log scale, showing the same scaling regions with a slope of −3 at high frequencies as in wakefulness (the PSD in wake is shown in shading in the background). At low frequencies, the scaling was close to 1/f2 (shaded line; the dotted line shows the 1/f scaling of wakefulness). (E) PSD calculated from the synaptic current in panel C, using a model including ionic diffusion. This PSD reproduces the scaling regions of slope −2 and −3, respectively (shaded lines). The low-frequency region, which was scaling as 1/f in wakefulness (dotted lines), had a slope close to −2. Experimental data taken from Destexhe et al. (37).

References

    1. Bhattacharya J., Petsche H. Universality in the brain while listening to music. Proc. Biol. Sci. 2001;268:2423–2433. - PMC - PubMed
    1. Bédard C., Kröger H., Destexhe A. Does the 1/f frequency scaling of brain signals reflect self-organized critical states? Phys. Rev. Lett. 2006;97:118102. - PubMed
    1. Novikov E., Novikov A., Shannahoff-Khalsa D., Schwartz B., Wright J. Scale-similar activity in the brain. Phys. Rev. E Stat. Phys. Plasmas Fluids Relat. Interdiscip. Topics. 1997;56:R2387–R2389.
    1. Pritchard W.S. The brain in fractal time: 1/f-like power spectrum scaling of the human electroencephalogram. Int. J. Neurosci. 1992;66:119–129. - PubMed
    1. Jensen H.J. Cambridge University Press; Cambridge, UK: 1998. Self-Organized Criticality: Emergent Complex Behavior in Physical and Biological Systems.

Publication types

LinkOut - more resources