. 2009 Apr 8;96(7):2648-57.
doi: 10.1016/j.bpj.2009.01.008.

Electrically silent divalent cation entries in resting and active voltage-controlled muscle fibers

Affiliations

Electrically silent divalent cation entries in resting and active voltage-controlled muscle fibers

Céline Berbey et al. Biophys J. .

Abstract

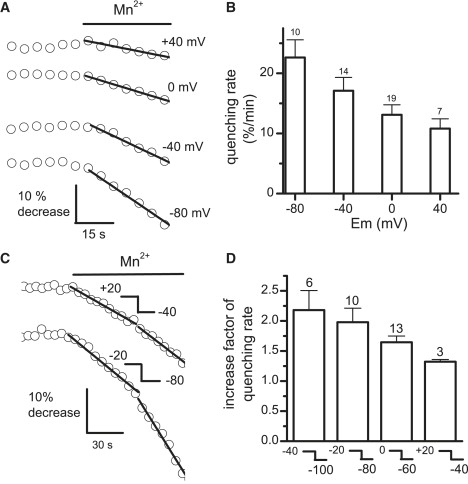
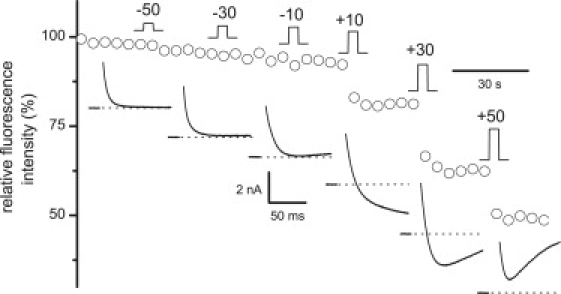
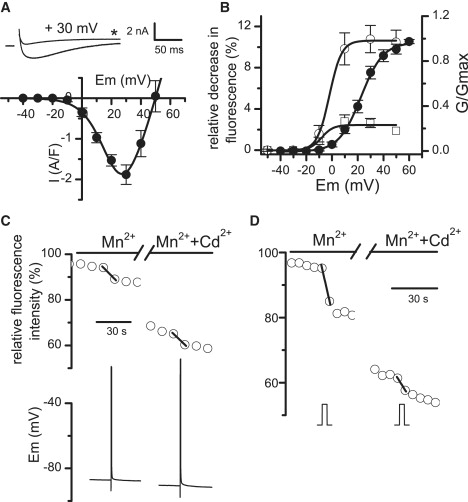
Ca2+ is known to enter skeletal muscle at rest and during activity. Except for the well-characterized Ca2+ entry through L-type channels, pathways involved in these Ca2+ entries remain elusive in adult muscle. This study investigates Ca2+ influx at rest and during activity using the method of Mn2+ quenching of fura-2 fluorescence on voltage-controlled adult skeletal muscle cells. Resting rate of Mn2+ influx depended on external [Mn2+] and membrane potential. At -80 mV, replacement of Mg2+ by Mn2+ gave rise to an outward current associated with an increase in cell input resistance. Calibration of fura-2 response indicated that Mn2+ influx was too small to be resolved as a macroscopic current. Partial depletion of the sarcoplasmic reticulum induced by a train of action potentials in the presence of cyclopiazonic acid led to a slight increase in resting Mn2+ influx but no change in cell input resistance and membrane potential. Trains of action potentials considerably increased Mn2+ entry through an electrically silent pathway independent of L-type channels, which provided 24% of the global Mn2+ influx at +30 mV under voltage-clamp conditions. Within this context, the nature and the physiological role of the Ca2+ pathways involved during muscle excitation still remain open questions.


Figures

Figure 1
Figure 1
Influence of the external Mn2+ concentration on Mn2+ influx at −80 mV. The bars indicate the periods during which the cell was exposed to an external Tyrode solution containing 3 mM Mn2+ (A) and 1 mM or 10 mM Mn2+ (B). The straight lines superimposed correspond to the linear regressions fitted to the fluorescence records with slopes of 27%/min in (A) and 14 and 38%/min in (B). (C) The histogram shows the average values of quenching rate obtained in the presence of increasing external Mn2+ concentrations. The numbers above each bar indicate the number of cells tested.
Figure 2
Figure 2
Influence of membrane potential on Mn2+ influx in the presence of 3 mM external Mn2+. (A) Effect of addition of Mn2+ on fura-2 fluorescence at the indicated voltages in four different cells. The slopes of the linear fits are 8%, 13%, 20%, and 29%/min at +40, 0, −40, and −80 mV, respectively. (B) Average values of quenching rate obtained at different membrane voltages. (C) Changes in the quenching rate induced by a 60mV-hyperpolarizing pulse given from a holding potential of +20 mV (upper trace) and −20 mV (lower trace). The slope of the linear fits increased from 9% to 13%/min in the upper trace and from 15% to 29%/min in the lower trace. (D) Effect of the holding potential on the change in the quenching rate induced by a 60mV-hyperpolarizing pulse.
Figure 3
Figure 3
Membrane currents evoked by replacement of Mg2+ by Mn2+. (A and B) Simultaneous recordings of membrane currents and fura-2 fluorescence at −80 mV and +40 mV. The slope of the linear fit is 24% and 12%/min at −80 and +40 mV, respectively. (C) Continuous recording of membrane current at −80 mV in response to replacement of 10 mM Mg2+ by 10 mM Mn2+. The cell was challenged by voltage ramps given from −40 to −100 mV at a rate of 120mV/s every 5 s in the presence of 140 mM external TEA-methanesulfonate plus 9AC and 120 mM internal Cs-aspartate. (D) Current-voltage relationships obtained in the fiber illustrated in (C) in response to voltage ramps, the lower and upper traces corresponding to the left and right arrows in (C), respectively.
Figure 4
Figure 4
Estimation of the sarcolemmal Mn2+ current on the basis of the measurement of the changes in fura-2 fluorescence induced by Mn2+ entry. (A) Relationships between the relative fluorescence of fura-2 and the concentration of Mn2+ in glass tubes (open symbols, n = 9), and the concentration of Mn2+ in the external solution bathing muscle fibers in the presence of ionomycin (solid symbols, n = 4). Curves were fitted using a Hill equation (see text for details). (B) Quenching of fura-2 fluorescence obtained in a fiber exposed to the indicated concentrations of Mn2+ in the presence of ionomycin. (C) Relationship between the estimated resting Mn2+ current and membrane voltage. The curve was drawn by eye.
Figure 5
Figure 5
Effects of trains of AP and CPA on Mn2+ influx under current clamp conditions. (A) Simultaneous recordings of fura-2 fluorescence (open symbols) and membrane potential (lower trace) in a fiber stimulated by positive suprathreshold current pulses of 0.5-ms duration delivered at 50 Hz. The duration of the trains was 2 s in the left panel and 3 s in the right panel. Each burst of stimulation was preceded by a negative current pulse of 2 nA amplitude to measure the fiber input resistance (downward deflections of the voltage trace). The inset shows the first train of AP (star, left trace) and the first AP of this train (right trace) on an expanded scale. The recordings presented in the right panel were obtained in the same fiber 4 min after the ones presented in the left panel. The external Tyrode solution contained 2 mM CaCl2 and 2 mM MgCl2 in which 1 mM Mn2+ was added. (B) In the continuous presence of a Tyrode solution containing 3 mM Mn2+, the fiber was stimulated by bursts of AP of 500 ms duration delivered at 50 Hz in the absence and in the presence of CPA. Fluorescence records were fitted with a linear regression in the presence of CPA with slopes of 4%/min before and of 10%/min after stimulation. (C) In this particular fiber, a single burst of AP given in the presence of CPA led to a brutal drop of fluorescence (the slope of the linear fit is 190%/min) and an irreversible depolarization of the fiber. Note that membrane potential in lower traces was acquired at 200 Hz so that peak values of AP could not be resolved.
Figure 6
Figure 6
Effect of depolarization steps of increasing amplitude on Mn2+ influx under voltage-clamp conditions. Fura-2 fluorescence (open symbols) and membrane currents (lower traces) were measured on the same muscle fiber in the presence of a 140 mM TEA-methanesulfonate Ca2+-free external medium containing 3 mM Mn2+. The cell was held at −80 mV, and voltage steps of 100-ms duration bringing the membrane potential to the indicated values were applied between two fluorescence image captures at the indicated position of the steps. Note that the corresponding currents were positioned under the voltage steps on a different time scale.
Figure 7
Figure 7
Voltage dependence of Mn2+ influx and effect of Cd2+. (A) The upper traces show the membrane currents recorded in a same fiber in response to a 200-ms depolarization step given to +30mV from a holding potential of −80 mV in the absence and in the presence of 0.5 mM Cd2+ (star) and the current-voltage relationship of the Mn2+ current. The curve was fitted using the equation indicated in Methods with values for Gmax, Vrev, V0.5, and k of 127 S/F, +50 mV, +22 mV, and 7.9 mV (n = 9). (B) Relationships between the mean normalized conductance of the voltage-activated Mn2+ current and membrane potential (solid symbols), between the mean Mn2+ influx, expressed as percentage of decrease of fluorescence, and membrane potential in the absence (open circles), and in the presence of 0.5 mM Cd2+ (open squares). The curves were fitted using a Boltzmann equation with values for V0.5 and k of +22 mV and 8.6 mV for the normalized conductance, −1.9 mV and 4.7 mV for the Mn2+ influx in the absence of Cd2+, and −8 mV and 4 mV for the Mn2+ influx in the presence of Cd2+. The number of cells tested at −10, +10, +30, and +50 mV is 8, 4, 4, and 2 in the absence of Cd2+ and 7, 8, 8, and 1 in the presence of Cd2+. (C) In the left panel, a single train of AP (lower trace) was elicited under current clamp conditions by injection of positive supraliminar current pulses of 0.5-ms duration delivered at 50 Hz in the presence of 3 mM external Mn2+, whereas fura-2 fluorescence was simultaneously recorded (open symbols). The same stimulation was applied in the same cell with 0.5 mM Cd2+ added in the external medium (right panel). The two consecutive recordings were separated by a 2-min interval. (D) In the left panel, the cell was held at −80 mV and a 100-ms depolarizing pulse was given to +30mV as indicated by the step at the bottom in the presence of 3 mM external Mn2+. The same stimulation was applied in the same cell with 0.5 mM Cd2+ added in the external medium (right panel). The two consecutive fluorescence recordings were separated by a 1-min interval. The fluorescence data points immediately before and after stimulations were linked by a straight line to make fluorescence drops more visible. The slopes of these lines were 30% and 29%/min in the absence and in the presence of Cd2+ in C, respectively, and 122% and 45%/min in D, respectively.

Similar articles

Cited by

References

    1. Clausen T., Dahl-Hansen A.B., Elbrink J. The effect of hyperosmolarity and insulin on resting tension and calcium fluxes in rat soleus muscle. J. Physiol. 1979;292:505–526. - PMC - PubMed
    1. Gailly P. New aspects of calcium signaling in skeletal muscle cells: implications in Duchenne muscular dystrophy. Biochim. Biophys. Acta. 2002;1600:38–44. - PubMed
    1. Haws C.M., Lansman J.B. Developmental regulation of mechanosensitive calcium channels in skeletal muscle from normal and mdx mice. Proc. Biol. Sci. 1991;245:173–177. - PubMed
    1. Hopf F.W., Turner P.R., Denetclaw W.F., Jr., Reddy P., Steinhardt R.A. A critical evaluation of resting intracellular free calcium regulation in dystrophic mdx muscle. Am. J. Physiol. 1996;271:C1325–C1339. - PubMed
    1. De Backer F., Vandebrouck C., Gailly P., Gillis J.M. Long-term study of Ca2+ homeostasis and of survival in collagenase-isolated muscle fibres from normal and mdx mice. J. Physiol. 2002;542:855–865. - PMC - PubMed

Publication types

MeSH terms