. 2009 Apr 8;96(7):2658-75.
doi: 10.1016/j.bpj.2008.11.073.

The fusion of membranes and vesicles: pathway and energy barriers from dissipative particle dynamics

Affiliations

The fusion of membranes and vesicles: pathway and energy barriers from dissipative particle dynamics

Andrea Grafmüller et al. Biophys J. .

Abstract

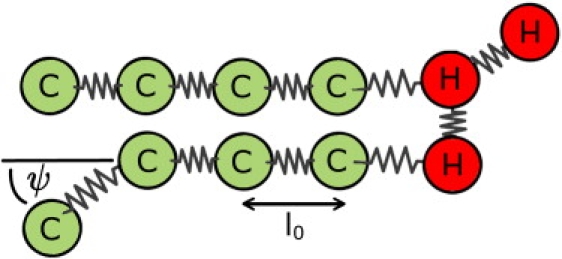
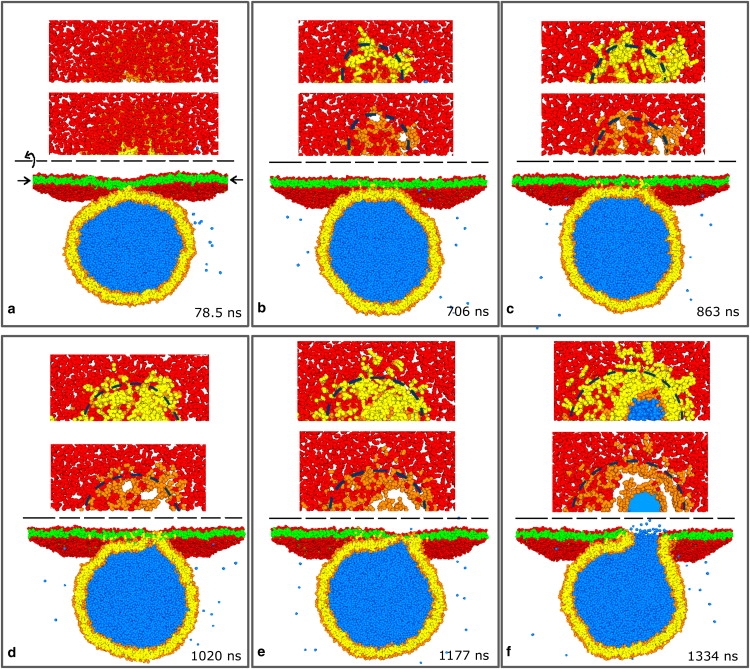
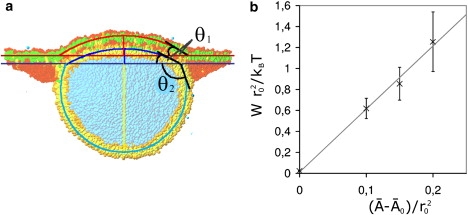
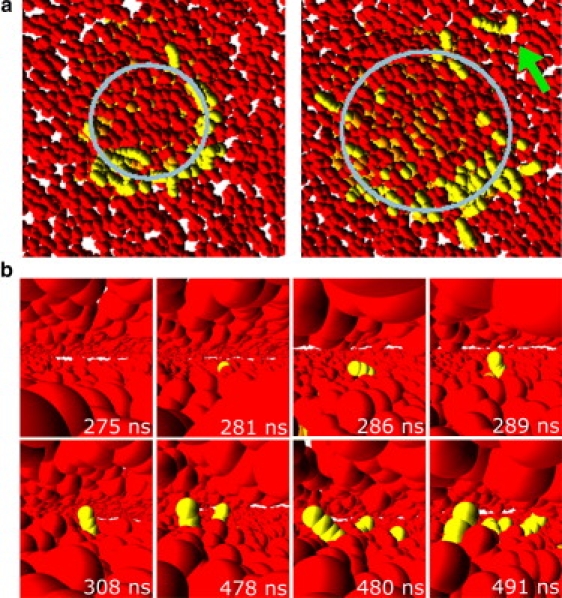
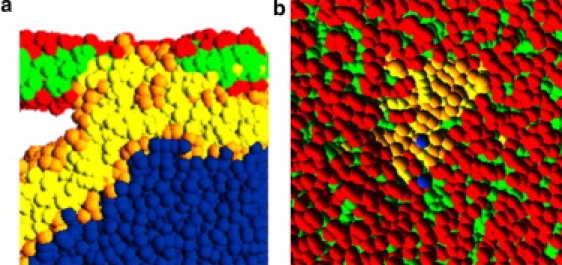
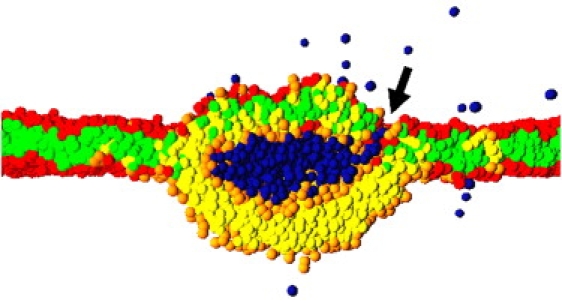
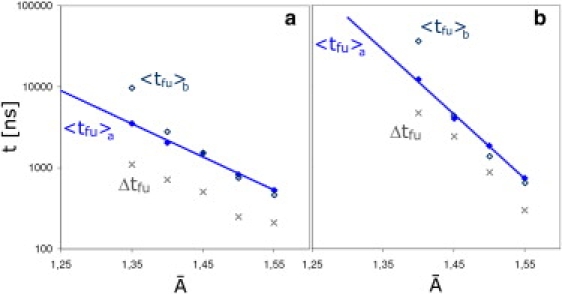
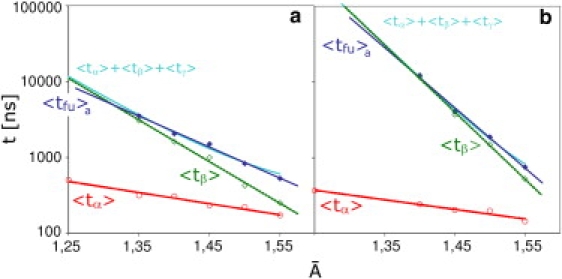
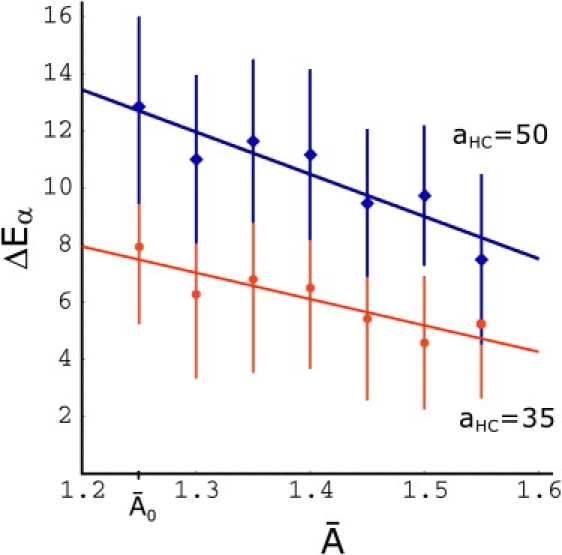
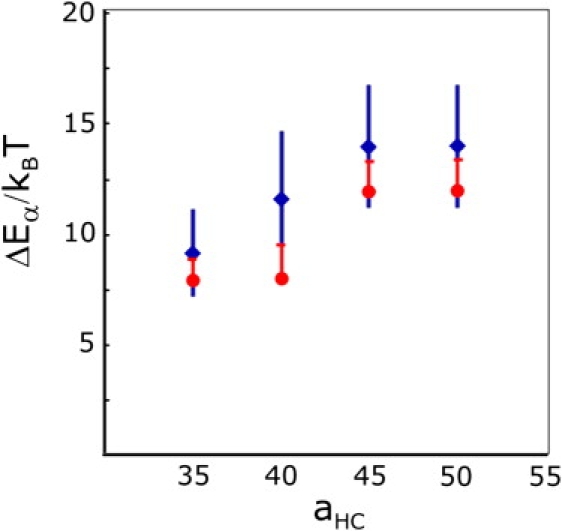
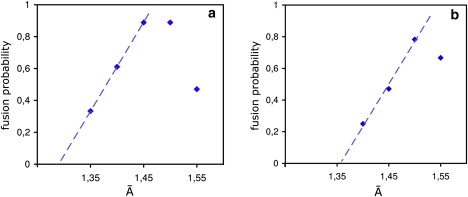
The fusion of lipid bilayers is studied with dissipative particle dynamics simulations. First, to achieve control over membrane properties, the effects of individual simulation parameters are studied and optimized. Then, a large number of fusion events for a vesicle and a planar bilayer are simulated using the optimized parameter set. In the observed fusion pathway, configurations of individual lipids play an important role. Fusion starts with individual lipids assuming a splayed tail configuration with one tail inserted in each membrane. To determine the corresponding energy barrier, we measure the average work for interbilayer flips of a lipid tail, i.e., the average work to displace one lipid tail from one bilayer to the other. This energy barrier is found to depend strongly on a certain dissipative particle dynamics parameter, and, thus, can be adjusted in the simulations. Overall, three subprocesses have been identified in the fusion pathway. Their energy barriers are estimated to lie in the range 8-15 k(B)T. The fusion probability is found to possess a maximum at intermediate tension values. As one decreases the tension, the fusion probability seems to vanish before the tensionless membrane state is attained. This would imply that the tension has to exceed a certain threshold value to induce fusion.


Figures

Figure 1
Figure 1
A coarse-grained model dimyristoyl-phosphatidylcholine (DMPC) with a H3(C4)2 architecture consisting of three head (H) beads and two hydrocarbon chains each consisting of chain (C) beads. Each chain bead C represents 3.5 CH2 groups. Consecutive beads are connected by springs of unstretched length l0. The hydrophobic chains are stiffened by a three-body potential constraining the angle ψ between two consecutive bonds.
Figure 2
Figure 2
Bilayer tension Σ¯ as a function of area per molecule A¯ calculated from the stress profile s(z) for the old DPD parameter set (9,17) (circles) and the new parameter set with improved stretching behavior (diamonds). For the new parameter set, Σ¯ has also been measured by direct z integration of the microscopic stress tensor (crosses). Error bars represent the standard error. The two methods are found to yield the same results. The two parameter sets are given in Table 1.
Figure 3
Figure 3
Simulations enforcing interbilayer flips of lipid tails are used to measure the energy barrier ΔE¯α for interbilayer flips. (a) From two adhering bilayers (head beads are blue/green, tail beads are omitted for clarity), a single lipid is selected (several red and one yellow tail beads), and a slowly moving external harmonic force F applied to one of its tail beads (yellow), until the tail has flipped to the other bilayer, so that the lipid has assumed a splayed configuration with one tail inserted in each bilayer as shown in panel c. (b) The energy landscape Eα for the bead is sketched as a function of the displacement z of the yellow bead. It has a high barrier in the center corresponding to the repulsive headgroups and increases to the sides reflecting displacement of the headgroup into the hydrophobic region.
Figure 4
Figure 4
Membrane tension Σ¯ as a function of molecular area A¯ for three different chain lengths of 3, 4, and 5 per tail chain, in the old (a) and new (b) parameter set. There is no state with zero tension for bilayers formed from lipids with three beads per chain in the old parameter set (a), since at low A¯ values the bilayer structure is not stable.
Figure 5
Figure 5
Fusion of a vesicle with a diameter of 28 nm to a planar membrane with a projected area of (50 nm)2. The vesicle consists of 6869 lipids (orange heads; yellow chains) while the planar membrane contains 6911 lipids (red heads; green chains). The water beads originally inside the vesicle are blue, those outside are not shown for clarity. Six snapshots illustrating the development of the fusion event from 78.5 ns after the first contact until opening of the fusion pore after 1334 ns. For each time, the system is shown from two perspectives: cross sections cut through the center of the vesicle viewed from the side, and two cross sections through the midplane of the planar membrane, as indicated by the arrows in panel a viewed from above. In the upper top views, the green hydrophobic beads from the planar bilayer are made transparent, revealing the yellow hydrophobic chains of vesicle lipids that have flipped into the planar bilayer. In the lower top views, all hydrophobic beads are set transparent, so that white areas in the headgroup plane indicate purely hydrophobic areas. Lipid tails start to undergo interbilayer flips after 78.5 ns. The growth of the contact area enhances these at the contact line, indicated by the blue broken line in panel b, creating a bean-shaped, disordered hydrophobic contact that nucleates into a hemifused diaphragm after 1177 ns.
Figure 6
Figure 6
(a) Example of a vesicle that adheres to a planar bilayer patch. Both the vesicle and the deformed segment of the planar membrane are well fitted by spherical caps, which define the two contact angles θ1 and θ2. (b) The dependence of the adhesion energy density W on the difference (A¯A¯0) of the area per molecule from its tensionless value. Each data point represents the average over data from 10 to 20 different snapshots. Error bars are mean ±1 SD and the solid line is the best linear fit.
Figure 7
Figure 7
The first interbilayer flips of the vesicle's hydrophobic chains (yellow) into the planar bilayer (head beads are red, chain beads not shown). (a) Top view of the planar membrane, constructed in the same way as the upper top views in Fig. 5. The hydrophobic chains and the upper monolayer of the planar bilayer are transparent, revealing the yellow hydrophobic beads of vesicle lipids that have flipped into the planar membrane. The rate of interbilayer flips is low, so that the influence of the contact line (gray circle) on the probability for interbilayer flips becomes clearly visible. The arrow indicates a flipped lipid that has diffused away from the contact area. At slow flipping rates this diffusion competes with the flipping. (b) Snapshots of the center of the planar membrane. These snapshots show the details of the first hydrophobic chains belonging to vesicle lipids (yellow) moving into the planar bilayer. At first only one tail flips, so that the lipid assumes a splayed conformation. Further lipids undergo the same transition in the vicinity, presumably because the splayed lipid sufficiently disturbs the bilayer structure. In the final snapshot, one lipid has flipped both of its tails into the other bilayer.
Figure 8
Figure 8
(a) Side view: an example of the disordered domain at the contact line. The hydrophobic material of the two bilayers (green/yellow) is no longer separated by a headgroup layer (red/orange) and has mixed. Several orange head beads are trapped in the center of this region. (b) Top view onto the planar bilayer patch. A small region of head beads from vesicle lipids (orange) appears between the planar bilayer lipids (red), indicating a region where several lipids from the vesicle have moved across the planar bilayer.
Figure 9
Figure 9
A 14-nm vesicle and part of a 50-nm planar bilayer at A¯=1.45, which have formed an extended hemifused contact. Only the central part of the simulation box is shown. A small pore, indicated by the arrow, has formed at the junction of the three bilayers. Such pores allow the pressure of the enclosed water to be reduced and fast lipid flip-flops between the inner and outer monolayers to occur.
Figure 10
Figure 10
The average fusion times 〈tfua (solid diamonds) and 〈tfub (open diamonds) as functions of the area per molecule A¯ displayed together with the widths Δtfu of the fusion time distributions (crosses) (a) for the 14-nm and (b) for the 28-nm vesicle. The two averages 〈tfua and 〈tfub represent a lower and upper bound for the average fusion time 〈tfu〉. Both 〈tfua and Δtfu seem to decrease exponentially with A¯.
Figure 11
Figure 11
The average duration of the tension-dependent subprocesses 〈tα〉 (red circles) and 〈tβ〉 (green open diamonds) displayed together with 〈tfua (blue solid diamonds) as a function of the area per molecule A¯ (a) for the 14-nm and (b) for the 28-nm vesicle. Both 〈tα〉 and 〈tβ〉 show an exponential dependence on A¯. The light blue curve represents a new fit of the fusion time based on the sum 〈tα〉 + 〈tβ〉 + 〈tγ〉, where 〈tγ〉 is the rupture time of the hemifused diaphragm.
Figure 12
Figure 12
The energy barrier ΔE¯α for the interbilayer flip of a lipid tail as a function of the area per molecule A¯ for two values of the head-tail force amplitude aHC, aHC = 50 (blue diamonds), and aHC = 35 (red circles). Each point is the average of 20 independent enforced interbilayer flips and the error bars represent mean ±1 SD. In the fusion simulations, the parameter value aHC = 35 has been used. The area A¯0=1.25 corresponds to the tensionless membrane.
Figure 13
Figure 13
(Diamonds) The average energy barrier height plotted against the strength of the head-tail force amplitude aHC. Each point is determined from 20 independent enforced interbilayer flips. The error bars represent mean ±1 SD. (Circles) The energy determined by the Jarzynski relation 5. The end of the upward bar indicates the average expended work up to second order of the cumulant expansion. The average barrier height clearly increases with larger values of aHC. Therefore, the latter parameter can be used to fine-tune the energy barrier for interbilayer flips.
Figure 14
Figure 14
Fusion probability as a function of molecular area A¯ for (a) the 14-nm and (b) the 28-nm vesicles. In both cases, the fusion probability, which represents the fraction of fusion attempts that lead to fusion within 20 μs, exhibits a maximum at A¯max with 1.45 < A¯max < 1.5 in panel a and A¯max ≃ 1.5 in panel b corresponding to the tensions Σ¯ ≃ 3.36 and Σ¯ ≃ 4.25, respectively. At higher tensions, fusion becomes less likely because of membrane rupture; at lower tensions, fusion is more and more replaced by adhesion or hemifusion. A linear extrapolation of the data to smaller values of A¯ indicates a molecular area threshold for fusion at A¯th = 1.29 for the 14-nm and A¯th = 1.36 for the 28-nm vesicle. This corresponds to a tension threshold Σ¯th ≃ 0.56 for the 14-nm vesicle and Σ¯th ≃ 1.79 for the 28-nm vesicle.

References

    1. Tamm L.K., Crane J., Kiessling V. Membrane fusion: a structural perspective on the interplay of lipids and proteins. Curr. Opin. Struct. Biol. 2003;13:453–466. - PubMed
    1. Lindau M., de Toledo G.A. The fusion pore. Biochim. Biophys. Acta Mol. Cell Res. 2003;1641:167–173. - PubMed
    1. Haluska C.K., Riske K.A., Marchi-Artzner V., Lehn J.M., Lipowsky R., Dimova R. Time scales of membrane fusion revealed by direct imaging of vesicle fusion with high temporal resolution. Proc. Natl. Acad. Sci. USA. 2006;103:15841–15846. - PMC - PubMed
    1. Noguchi H., Takasu M. Fusion pathways of vesicles: a Brownian dynamics simulation. J. Chem. Phys. 2001;115:9547–9551.
    1. Müller M., Katsov K., Schick M. New mechanism of membrane fusion. J. Chem. Phys. 2002;116:2342–2345.

Publication types