. 2009 Apr 8;96(7):2888-900.
doi: 10.1016/j.bpj.2008.12.3942.

The three-dimensional dynamics of actin waves, a model of cytoskeletal self-organization

Affiliations

The three-dimensional dynamics of actin waves, a model of cytoskeletal self-organization

Till Bretschneider et al. Biophys J. .

Abstract

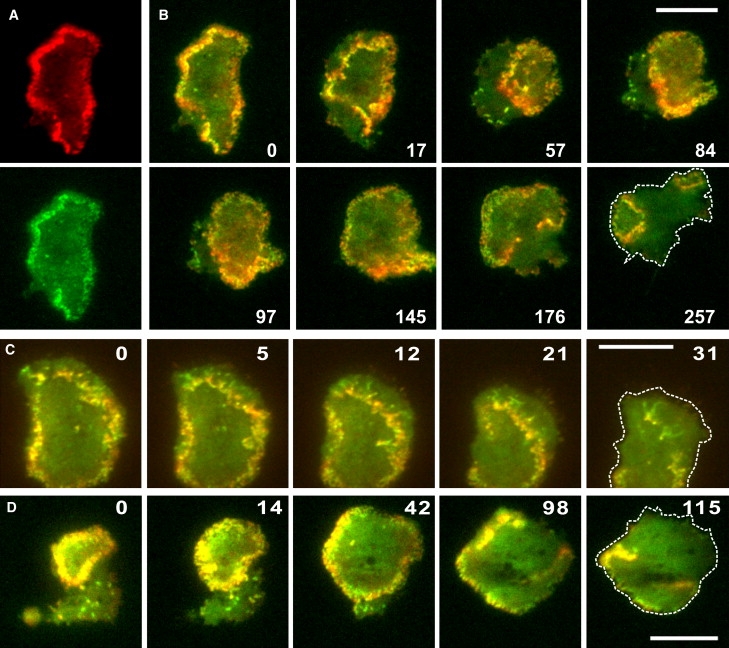
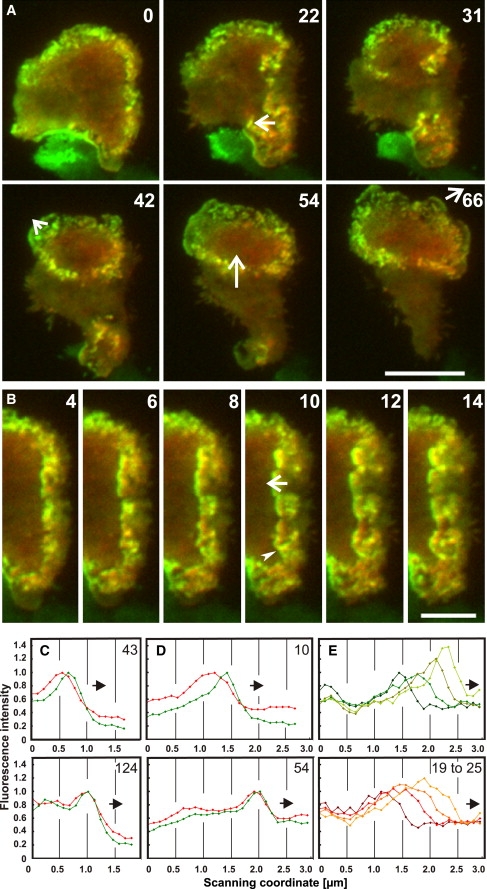
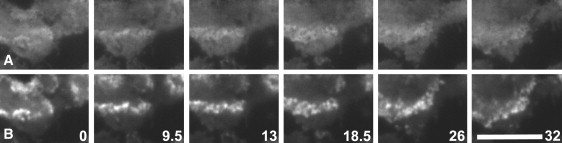
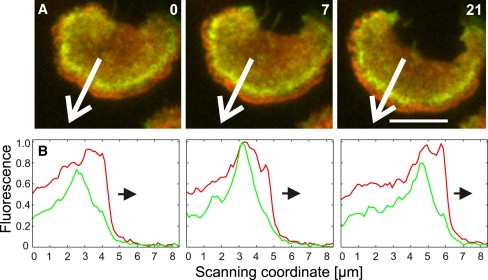
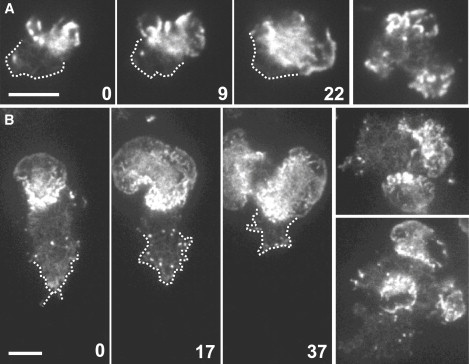
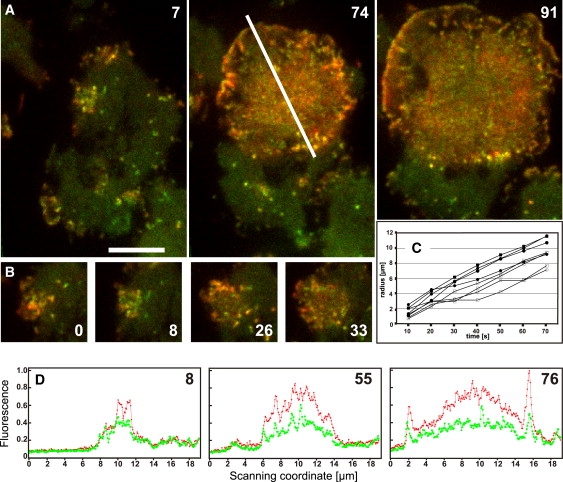
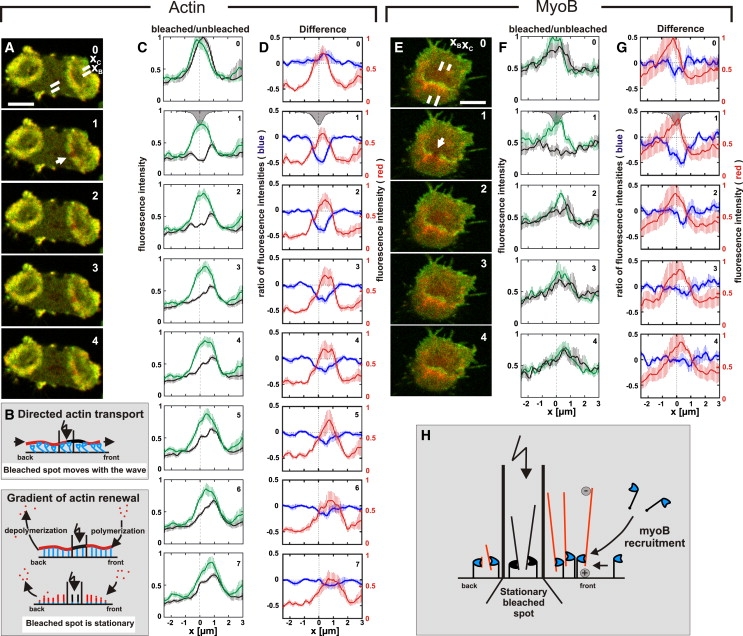
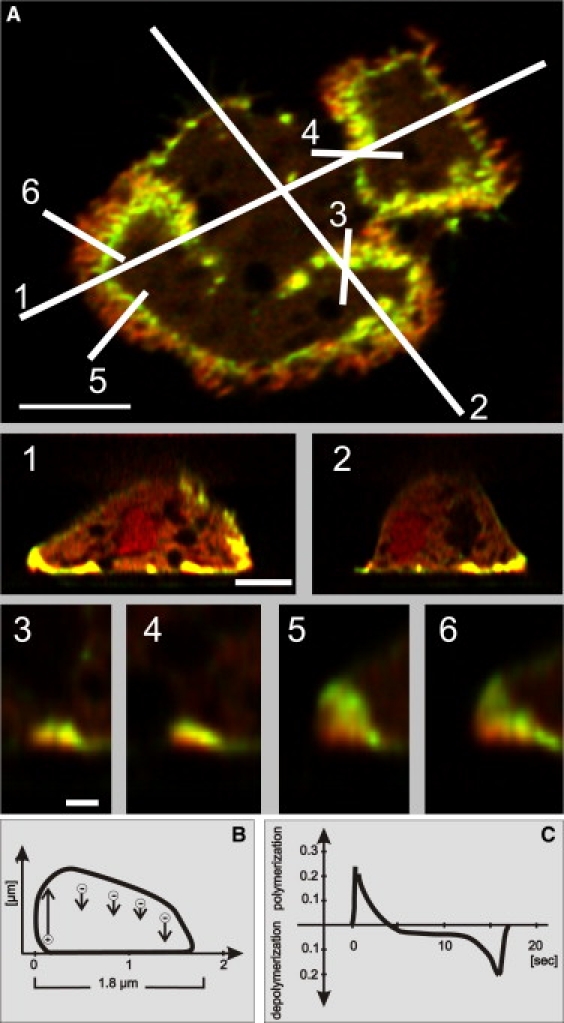
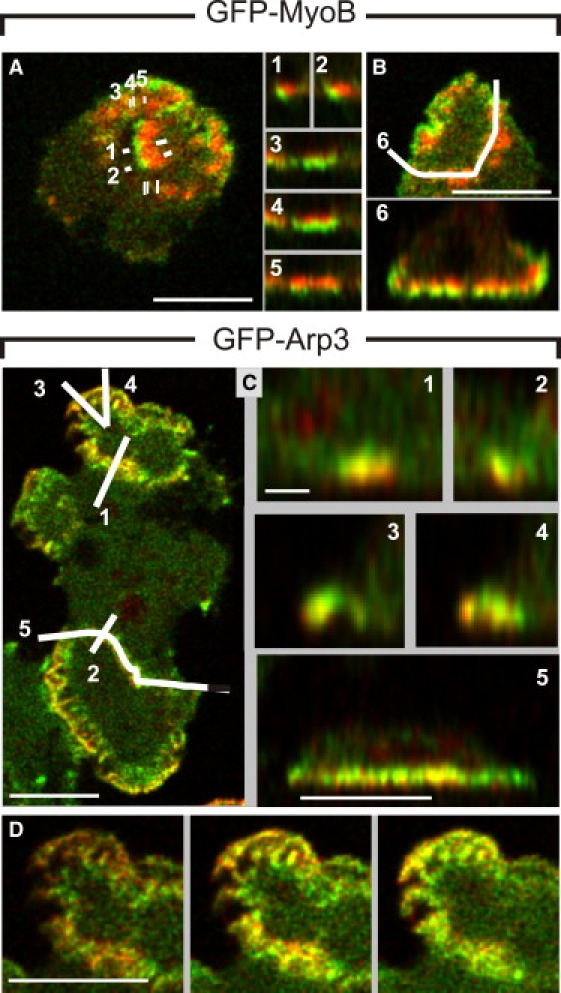
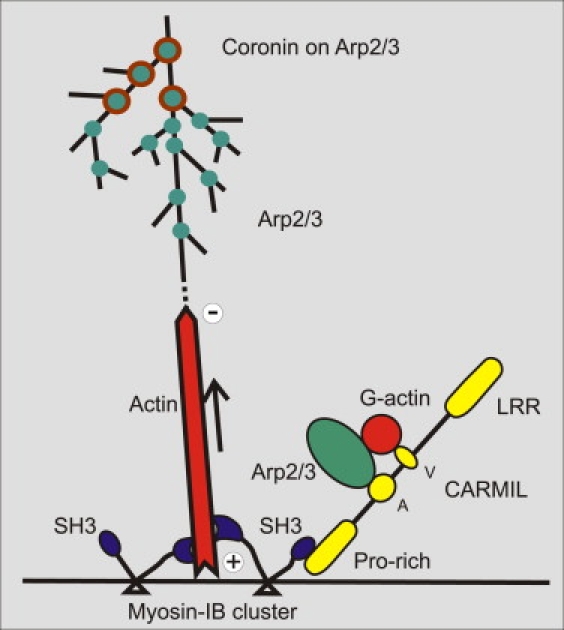
Actin polymerization is typically initiated at specific sites in a cell by membrane-bound protein complexes, and the resulting structures are involved in specialized cellular functions, such as migration, particle uptake, or mitotic division. Here we analyze the potential of the actin system to self-organize into waves that propagate on the planar, substrate-attached membrane of a cell. We show that self-assembly involves the ordered recruitment of proteins from the cytoplasmic pool and relate the organization of actin waves to their capacity for applying force. Three proteins are shown to form distinct three-dimensional patterns in the actin waves. Myosin-IB is enriched at the wave front and close to the plasma membrane, the Arp2/3 complex is distributed throughout the waves, and coronin forms a sloping layer on top of them. CARMIL, a protein that links myosin-IB to the Arp2/3 complex, is also recruited to the waves. Wave formation does not depend on signals transmitted by heterotrimeric G-proteins, nor does their propagation require SCAR, a regulator upstream of the Arp2/3 complex. Propagation of the waves is based on an actin treadmilling mechanism, indicating a program that couples actin assembly to disassembly in a three-dimensional pattern. When waves impinge on the cell perimeter, they push the edge forward; when they reverse direction, the cell border is paralyzed. These data show that force-generating, highly organized supramolecular networks are autonomously formed in live cells from molecular motors and proteins controlling actin polymerization and depolymerization.


Figures

Figure 1
Figure 1
Dynamics of actin waves and recruitment of the Arp2/3 complex. Cells expressing mRFP-LimEΔ to label filamentous actin structures and GFP-Arp3 for incorporation into the Arp2/3 complex were recorded by dual-emission TIRF microscopy during recovery from latrunculin A treatment. (A) Images of the mRFP channel (top) and GFP channel (bottom) of the first frame of the time series shown in B. (B) A wave undergoing contraction, expansion, and splitting. The time series starts with the same frame (0) as shown in A. The two labels are superimposed on each other, yellow indicating merger of the labels. The same cell is shown in Movie S3. (C) Merged images of a collapsing wave, showing substructures more enriched in either actin or Arp2/3 and trailing of the Arp2/3 label behind the wave. (D) Merged images of a circular wave expanding the cell border. This protrusion stops when the wave starts to collapse. In the last panels of each sequence, cell borders are accentuated by dashed lines. Time is indicated in seconds. Bars, 10 μm.
Figure 2
Figure 2
MyoB at the front of waves and their substructures. The GFP-MyoB label (green) is superimposed on the mRFP-LimEΔ label for filamentous actin (red). Cells recovering from latrunculin A treatment were recorded by TIRF microscopy (A,B) and fluorescence profiles quantified by line scans (C–E). (A) A wave showing irregular orientation of substructures during its reversal from collapsing to expanding. (B) A wave front in the same cell propagating from the right to the left and showing partitioning into ensembles led by MyoB. (Arrowhead in the 10-s frame; see also Movie S5 for substructure dynamics). Time is indicated in seconds after the first frame in A. Bars, 10 μm in A and 5 μm in B. (C) Two scans through waves that expand the cell border. (D) Two scans through retracting portions of waves that propagate on the substrate-attached cell surface. (E) Separate propagation of a substructure as indicated in the 22-s frame of A, plotted at 2-s intervals. (Top panel: dark to light green for MyB. Bottom panel: dark to light red for the actin label). Arrows in A and B indicate local direction of wave propagation and position of the scans in C–E. Numbers within panels C–E are seconds after the first frame in A; corresponding scan positions are indicated in A and B. (Position of the 124-s scan is indicated in the 66-s panel of A.) In C–E, the directions of wave propagation are plotted toward the right as indicated by arrows.
Figure 3
Figure 3
CARMIL in a wave that changes direction. The time series obtained by TIRF microscopy shows part of a cell expressing GFP-CARMIL and mRFP-LimEΔ; numbers indicate seconds. (Top panels) Channel showing the emission of GFP-CARMIL. (Bottom panels) Channel showing the emission of mRFP-LimEΔ. Up to the 13-s frame, the wave is moving toward the top, and subsequently toward the bottom of the panels. Bar, 10 μm.
Figure 4
Figure 4
TIRF images localizing coronin to the back of actin waves. The cells coexpress GFP-coronin (green) and mRFP-LimEΔ (red). (A) Three stages of a wave propagating from top to bottom and showing a regular zonal pattern. (B) Scans of fluorescence intensities along the lines indicated in A. These scans quantify fluorescence intensities in a plane close the substrate, which is limited by the z-axis penetration of the evanescent field generated at 488 nm for the excitation of both the GFP and mRFP labels. Within this plane, the actin label (red) sharply rises at the wave front, whereas the increase of coronin fluorescence (green) is less steep. Consequently, coronin peaks at the posterior side of the zone populated by filamentous actin. Time is indicated in seconds. Bar, 5 μm.
Figure 5
Figure 5
Independence of wave formation from signal transduction through heterotrimeric G-proteins. (A) Parent strain DH1. (B) Gβ-null mutant LW6 (27), both expressing LimEΔ-GFP. Time series on the left show the evolution of single waves; the one in B is split into two. Numbers indicate seconds. Panels on the right exemplify cells with two or three waves. Outside the waves the actin network in the cell cortex is distinguishable. The actin patches in this area are mostly involved in clathrin-dependent endocytosis (51). The two time series are typical in showing retraction of this area when the wave expands, as indicated by dotted lines. Bars, 10 μm.
Figure 6
Figure 6
Wave propagation without SCAR. The expression of mCherry-LimEΔ and GFP-Arp3 in SCAR-null cells shows waves propagating with normal speed and their association with the Arp2/3 complex. (A) Merged images of mRFP-LimEΔ (red) and GFP-Arp3 (green) in three stages of an expanding wave. (B) Sequence illustrating origin of this wave from an area of dense and dynamic actin and Arp2/3 assembly. Time is indicated in seconds. Bar for A and B, 5 μm. (C) Velocity of wave expansion in SCAR-null cells. Distance of the actin front from the origin of two waves is determined (open symbols for the one shown in A and B and Movie S13; solid symbols for the one shown in Movie S14). In each wave, expansion has been measured in four directions, either over the cell body (circles), i.e., toward the bottom in A or over the free substrate surface (squares), i.e., toward the top in A. (D) Three scans of fluorescence intensities (in arbitrary units) along the line indicated in A. Red, mCherry-LimEΔ; green, GFP-Arp3. Numbers indicate seconds in accord with A and B. On the left of each panel the wave propagates toward the top in A, on the right toward the bottom.
Figure 7
Figure 7
Actin and MyoB dynamics in a propagating wave as revealed by FRAP. (A) FRAP in a cell double-labeled with GFP-actin and mRFP-LimEΔ. Numbers in the panels indicate seconds after beginning of the recording. The 0-s frame was recorded before and the 1-s frame immediately after bleaching. Scans of fluorescence intensities through the bleached area (xB) and the unbleached control area (xC) are indicated in the 0-s frame. The bleached spot is indicated by an arrow in the 1-s frame. The wave propagates from left to right. (B) Diagram illustrating putative modes of wave propagation and their distinction by FRAP. In the top panel actin is assumed to be translocated, for instance, by the motor activity of myosin along the membrane of the cell (black line). In the middle and bottom panels actin is assumed to be membrane-anchored and the wave to propagate in a treadmilling mode. In this case, the wave might propagate by elongation of actin filaments along the membrane (middle) or by the nucleation of new filaments (bottom). (C) Linear scans of fluorescence intensities of GFP-actin along xB (black) and xC (green) in the direction of wave propagation. The gray profile in the 1-s frames circumscribes the actual distribution of fluorescence intensities in the bleached area. Dashed vertical lines indicate the center position of the bleached area in the xB scan or the corresponding laterally shifted position in the xC scan. (D) Blue curves: difference of the fluorescence intensities along the scan through the bleached area (xB) minus the scan through the unbleached area (xC). These curves show the dip caused by bleaching and recovery of the GFP-actin fluorescence within a 7-s period. Red curves: mRFP-LimEΔ label showing wave positions in the unbleached area (xC scan). (E–G) FRAP of a cell double-labeled with GFP-MyoB and mRFP-LimEΔ. The panels E, F, G correspond to panels A, C, D, respectively. In E, the wave is propagating from bottom to top. (H) Diagram illustrating MyoB recruitment. The FRAP data argue against the movement of MyoB along actin filaments in the direction of wave propagation. They indicate that MyoB is recruited from outside to the wave front, probably by diffusion within the cytoplasm and on the membrane (arrows on the right). MyoB heads are colored blue, and actin filaments red, outside the bleached area; their orientation is hypothetical. Fluorescence intensities were recorded by concomitant excitation of GFP and mRFP at 488 nm and separation of the emissions. The plots in C and D represent averages from eight experiments; the plots in F and G from six experiments. Vertical bars indicate standard errors of the mean. Scale bars in A and E, 5 μm.
Figure 8
Figure 8
Three-dimensional patterns of coronin distribution in actin waves. (A) The z-stacks were acquired by spinning-disk confocal microscopy from a cell double-labeled with GFP-coronin (green) and mRFP-LimEΔ (red). Three-dimensional protein patterns are constructed from deconvolved images. (Top panels) Confocal plane close to the substrate, showing a zonal actin-coronin pattern similar to the TIRF images of Fig. 4. In the x,y plane of A, lines 1–6 indicate the directions of z-scans shown in the middle and bottom panels. These scans are oriented such that the number of each line in the top panel corresponds to the left-hand side of the frames below. (Middle panels) The z-scans 1 and 2 through the entire cell illustrate localization of the waves marked by actin and coronin on the bottom surface and at the border of the cell. (Bottom panels) Actin-coronin patterns in waves at higher magnification. Scans 3 and 4 show waves propagating on the bottom surface of the cell, and scans 5 and 6 waves in contact with the cell border. Bars, 5 μm for the top and middle panels and 1 μm for the bottom panels. (B) Scheme of a wave modeled according to the regular shape of scan 4 (A). Assuming that the height of the actin layer (including the coronin-enriched zone) reflects the net rate of actin polymerization, there is rapid polymerization going on at the front, followed by continuous net depolymerization up to the back of the wave. (C) The spatial profile of B can be translated into a temporal sequence. Here we assume that the wave propagates with constant velocity of 6 μm/min as in the waves in Figs. 2 and 4. The profile illustrates the sequence of changes in net polymerization or depolymerization of actin at a point on the membrane when a wave passes. These data suggest that a short phase of high-rate actin polymerization turns abruptly into a longer phase of net depolymerization.
Figure 9
Figure 9
Three-dimensional distribution of MyoB and Arp2/3 in actin waves. Cells double-labeled either with GFP-MyoB or GFP-Arp3 and mRFP-LimEΔ were subjected to spinning disk confocal microscopy, and deconvolved distributions in the z-direction obtained from image stacks. (A) (Left panel) A wave with a clear zonal pattern of MyoB (green) and actin (red) in a plane of focus close to the substrate surface. (Right panels) Z-scans 1 to 5 as indicated in the left panel. Scans 1 and 2 show cross sections through the wave; scans 3 to 5 sections parallel to the wave from the front (3) to the back (5). (B) Wave extending from cell edge to edge (top), and the distribution in the z-direction of MyoB and actin along scan 6 (bottom). (C) A cell double-labeled with GFP-Arp3 and mRFP-LimEΔ. (Left panel) Optical plane showing two waves in which the Arp2/3 complex (green) and actin (red) overlap but do not completely coincide. (Right panels) Z-scans 1 to 5 along the lines indicated on the left. (D) Z-series of three x,y scans through the wave shown on top of the cell in C. These scans are acquired at distances of 200 nm beginning with the left panel close to the substrate-attached cell surface. Bars, 5 μm except 1 μm in scans 1 to 4 of C.
Figure 10
Figure 10
Hypothetical role of MyoB in organizing actin filaments into waves and in recruiting the Arp2/3 complex. Based on the z-scans shown in Fig. 9A, MyoB (blue) is proposed to assist by multiple interactions in organizing the membrane-anchored actin network. MyoB binds with its tail (triangles) to the plasma membrane (42), and its N-terminal motor domain moves toward the plus end of actin filaments. In that way, clusters of MyoB may keep the growing filaments separate from the membrane (arrow), thus allowing subunits to enter. The C-terminal SH3 domain of MyoB interacts with the proline-rich region of the adaptor protein CARMIL (yellow), which links MyoB to the Arp2/3 complex through its acidic domain (A). These interactions of CARMIL as well as the presence of the protein-protein interacting, verprolin-like (V), and leucine-rich-repeat (LRR) sequences are adopted from Jung et al. (13). The actin filaments are branched at sites of Arp2/3 binding (green) until activity of the Arp2/3 complex is inhibited by coronin (brown circles).

References

    1. Gerisch G., Bretschneider T., Müller-Taubenberger A., Simmeth E., Ecke M. Mobile actin clusters and traveling waves in cells recovering from actin depolymerization. Biophys. J. 2004;87:3493–3503. - PMC - PubMed
    1. Vicker M.G. Eukaryotic cell locomotion depends on the propagation of self-organized reaction-diffusion waves and oscillations of actin filament assembly. Exp. Cell Res. 2002;275:54–66. - PubMed
    1. Weiner O.D., Marganski W.A., Wu L.F., Altschuler S.J., Kirschner M.W. An actin-based wave generator organizes cell motility. PLoS Biol. 2007;5:2053–2063. - PMC - PubMed
    1. Bretschneider T., Diez S., Anderson K., Heuser J., Clarke M. Dynamic actin patterns and Arp2/3 assembly at the substrate-attached surface of motile cells. Curr. Biol. 2004;14:1–10. - PubMed
    1. Rehberg M., Kleylein-Sohn J., Faix J., Ho T.-H., Schulz I. Dictyostelium LIS1 is a centrosomal protein required for microtubule/cell cortex interactions, nucleus/centrosome linkage, and actin dynamics. Mol. Biol. Cell. 2005;16:2759–2771. - PMC - PubMed

Publication types

LinkOut - more resources