. 2009 Jul;132(1):32-42.
doi: 10.1016/j.clim.2009.02.011. Epub 2009 Apr 5.

TRAIL, DR4 and DR5 are upregulated in kidneys from patients with lupus nephritis and exert proliferative and proinflammatory effects

Affiliations

TRAIL, DR4 and DR5 are upregulated in kidneys from patients with lupus nephritis and exert proliferative and proinflammatory effects

Vinh Nguyen et al. Clin Immunol. 2009 Jul.

Abstract

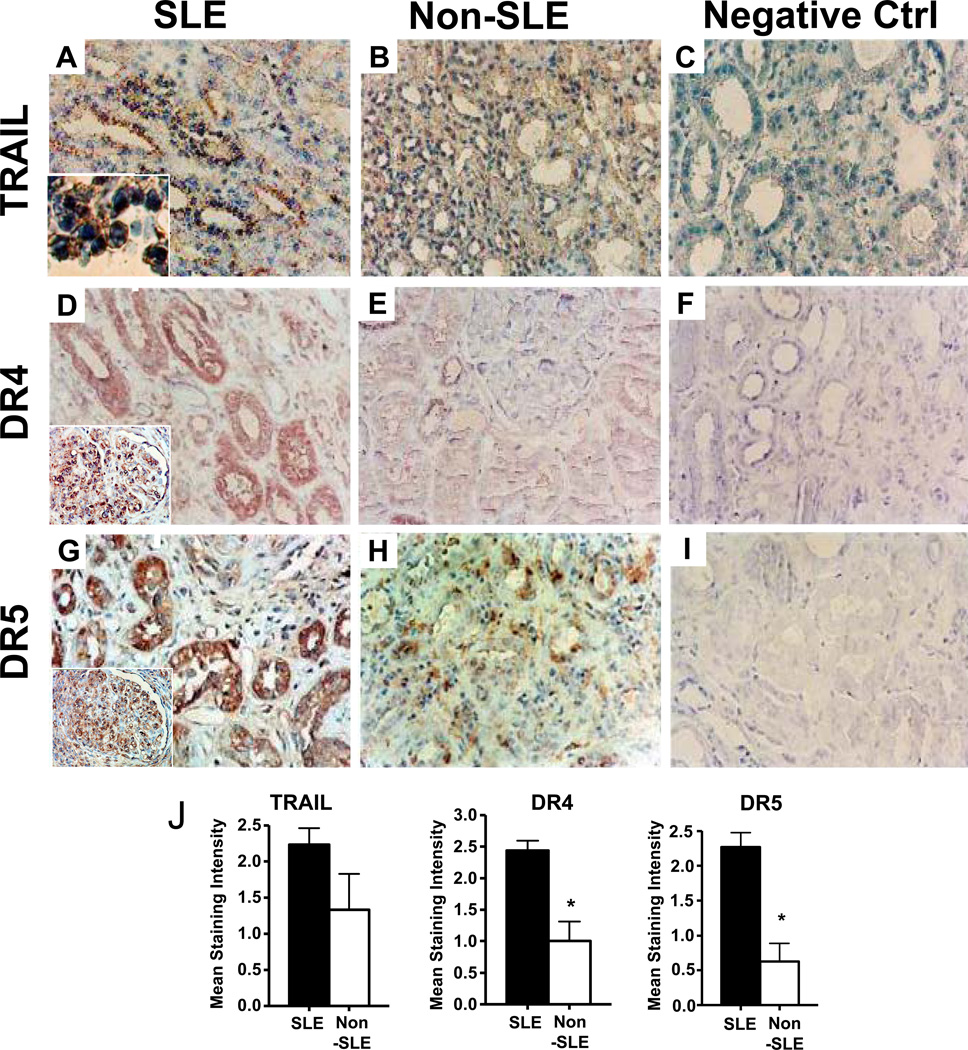
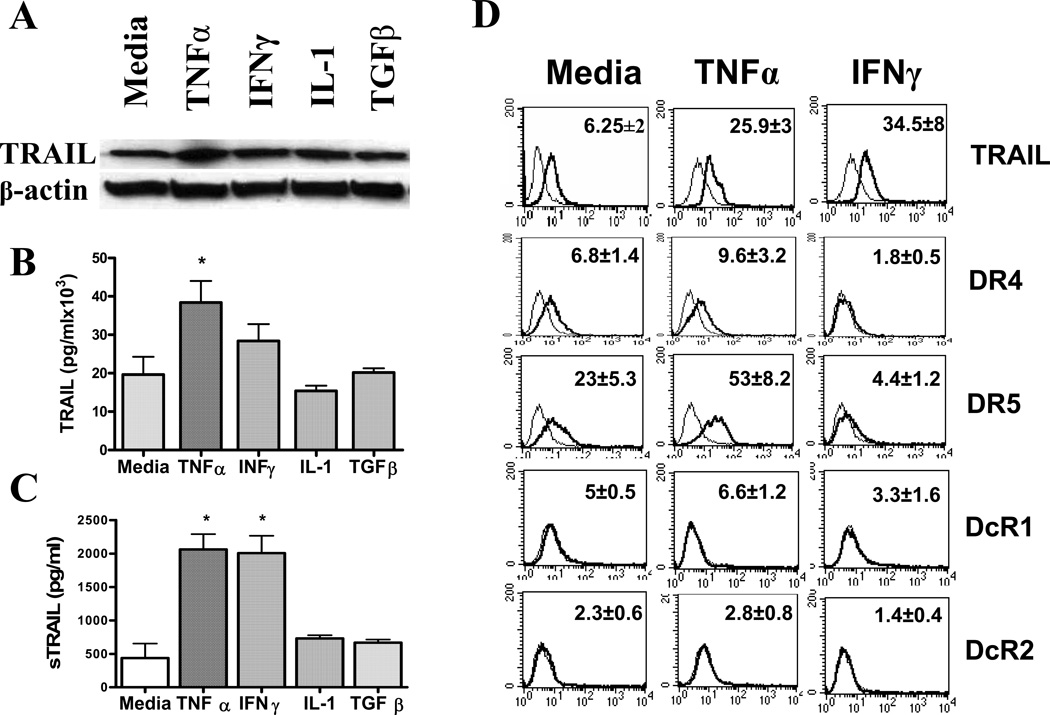
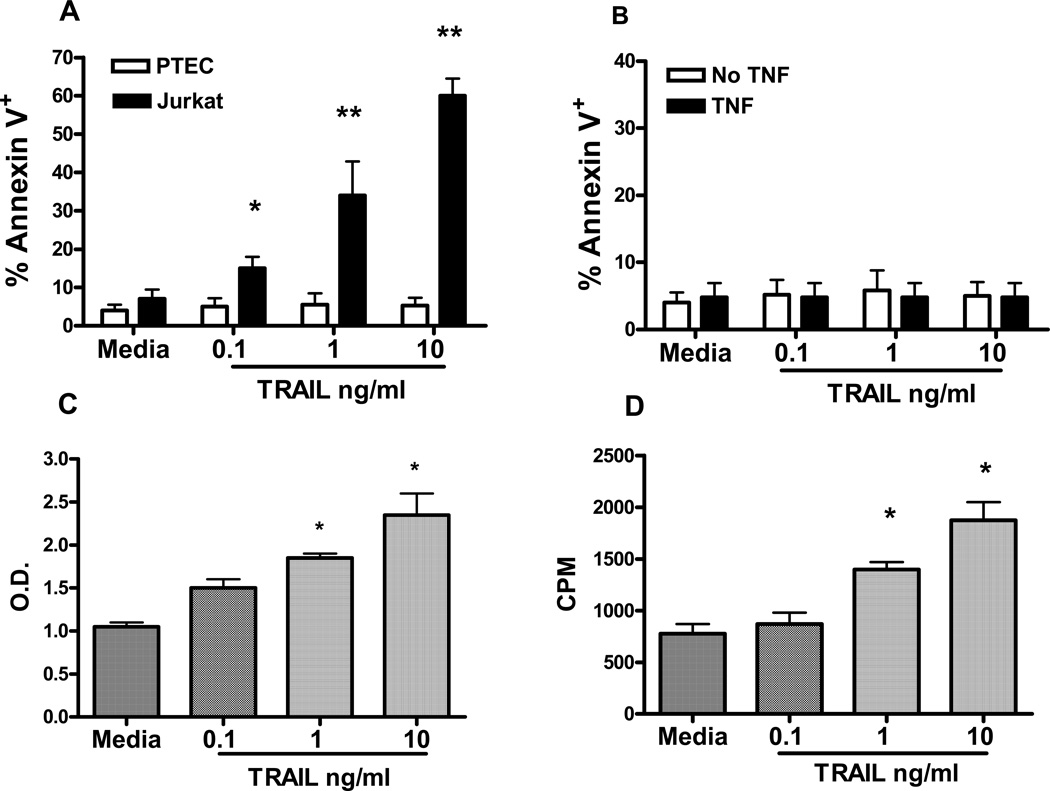
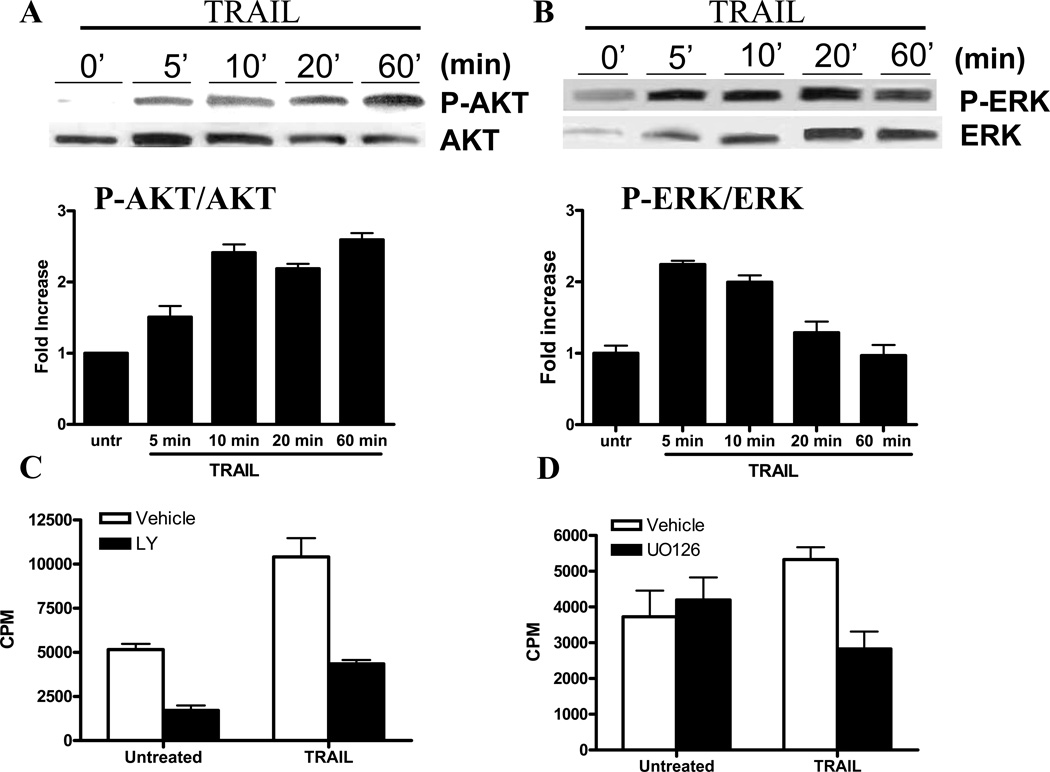
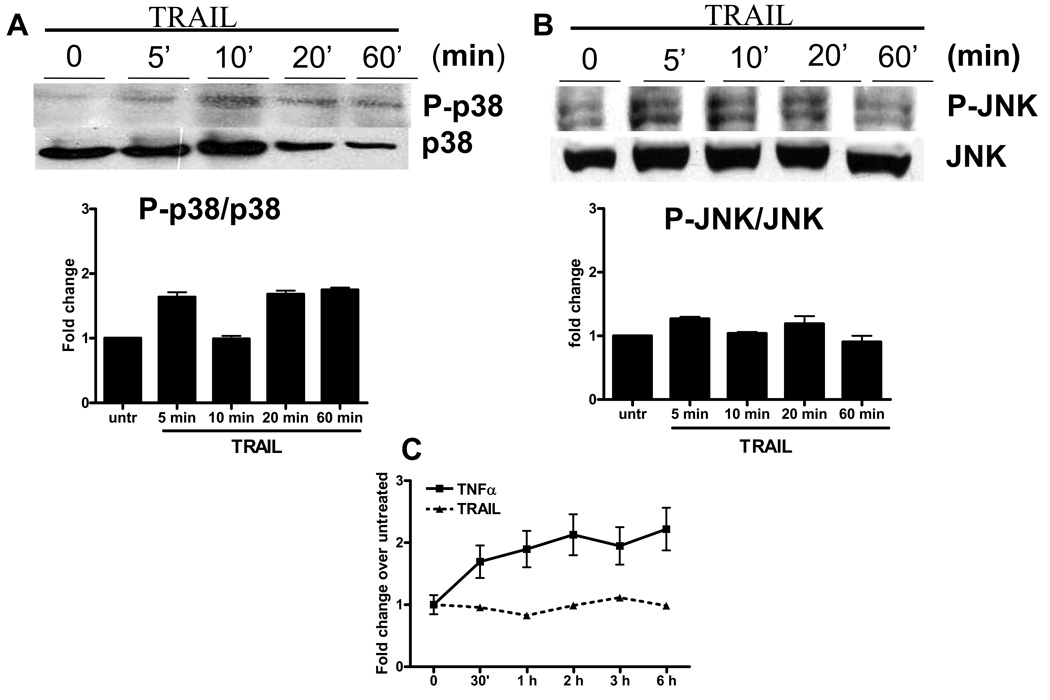
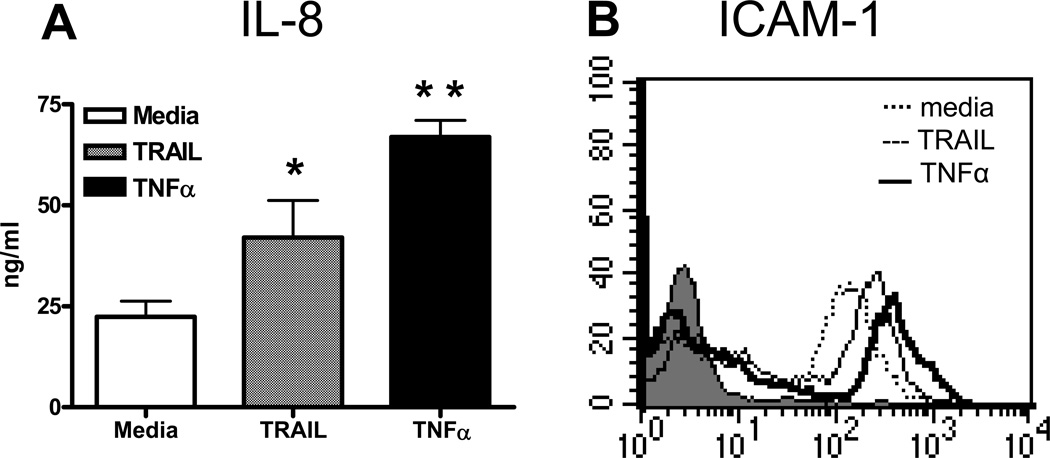
We have previously reported that TRAIL is upregulated on T cells from patients with lupus and that T cell associated TRAIL enhances autoimmune parameters in a murine model of lupus. Whether TRAIL/TRAIL-R interaction plays a role in organ involvement such as lupus nephritis has not yet been assessed. We demonstrate here that TRAIL, DR4 and DR5 are upregulated in proximal and distal tubules of patients with proliferative lupus nephritis. In vitro, expression of TRAIL, DR4 and DR5 on primary proximal tubular epithelial cells (PTEC) was induced by TNFalpha and IFNgamma. Functionally, TRAIL did not induce apoptosis but rather enhanced the proliferation of PTEC through activation of PI3 kinase/AKT and ERK1/2, increased IL-8 production and upregulated ICAM-1 expression. These data demonstrate that cytokine induced upregulation of TRAIL, DR4 and DR5 in tubules from patients with proliferative lupus nephritis may play a protective role by enhancing PTEC survival while also exerting a proinflammatory effect that may contribute to local inflammation and injury.


Figures

Figure 1
Figure 1. TRAIL, DR4 and DR5 expression in kidney biopsies from patients with proliferative lupus nephritis
In situ expression of TRAIL (A–C), DR4 (D–F) and DR5 (G–I) was determined by indirect immunoperoxidase on archived paraffin kidney biopsy specimens from 20 patients with class III and IV lupus GN (A, D, G) and 9 non-lupus renal disease (minimal change disease in B and E and ATN in H). Immunostaining is seen as the reddish-brown deposits in proximal and distal tubules. TRAIL expression in infiltrating mononuclear interstitial cell (panel A insert arrow) and DR4 and DR5 staining in glomerular endothelial cells (panel D and G inserts). Negative staining controls were performed without the addition of the primary antibody (C, F, I). Magnification ×100. J. Mean TRAIL, DR4 and DR5 tubular staining intensity in SLE and non-SLE renal diseases. Staining intensity was graded on a scale of 0 (no staining) to 3+ (intense staining). Data represent mean ± SE. *= p<0.05.
Figure 2
Figure 2. TRAIL and TRAIL receptors expression in human PTEC
A–C. Monolayers of primary PTEC grown to subconfluency were cultured in the presence or absence of TNFα (30ng/ml), IFNγ (300U/ml), IL-1 (20 ng/ml) or TGFβ (2ng/ml). After 48h the expression of TRAIL was determined in cell lysates (A and B) and supernatants (C) by Western blot and ELISA, respectively. Values represent mean plus SD of triplicate samples. *= p<0.05 compared to media. D. Representative histogram of TRAIL, DR4, DR5, DcR1 and DcR2 surface expression on PTEC cultured in the presence or absence of TNFα or IFNγ determined by flow cytometry and expressed as % positive cells. Control antibody is shown (thin line). Values represent mean percentage ± SE of three different donors.
Figure 3
Figure 3. Recombinant TRAIL induces proliferation but not apoptosis of PTEC
A. Primary PTEC were incubated with 0.1, 1 or 10 ng/ml of TRAIL for 18h and apoptotic cells were measured by Annexin V staining. Jurkat cells, which are sensitive to TRAIL-mediated apoptosis, were used as positive controls. B. PTEC were preincubated for 24h with or without TNFα (30 ng/ml) then incubated for 18h with with 0.1, 1 or 10 ng/ml TRAIL. C and D. PTEC were incubated with 0.1, 1 or 10 ng/ml TRAIL and proliferation was determined by CellTiter AQueos assay (Promega) and by [3H]-Thymidine incorporation. Results represent means ± SE of three separate experiments. *= p<0.05; **=p<0.005 versus media.
Figure 4
Figure 4. Activation of AKT and ERK1/2 in response to TRAIL
PTEC cells were stimulated with 2 ng/ml TRAIL for 0–60 minutes. Cell lysates were analyzed for activation of AKT (A) and ERK1/2 (B) by Western blot analysis of total and phosphorylated (P)-AKT and -ERK1/2 using specific antibodies. Protein bands were quantified by densitometry and levels of P-AKT and P-ERK1/2 were calculated for each time point after normalization to AKT and ERK1/2 in the same sample. Unstimulated basal expression was set as unity. C and D. PTEC cells were preincubated for 1 hour with PI3K inhibitor LY 294002 (C), MEK1/2 inhibitor UO126 (D) or vehicle then treated with TRAIL for 72h. Cell proliferation was assessed by [3H]-Thymidine incorporation. Results represent means ± SE of three separate experiments.
Figure 5
Figure 5. Lack of p38 kinase, JNK and NF-kB activation in PTEC in response to TRAIL
PTEC were stimulated with 2 ng/ml TRAIL for 0–60 minutes. Cell lysates were analyzed for activation of p38 kinase (A) and JNK (B) by Western blot analysis of total and phosphorylated (P)-p38 and -JNK using specific antibodies. Protein bands were quantified by densitometry and levels of P-p38 and P-JNK were calculated for each time point after normalization to p-38 and JNK in the same sample. Unstimulated basal expression was set as unity. C. Activation of NF-kB p65 was measured in nuclear extracts of TRAIL treated PTEC cells by ELISA. TNFα stimulation was used as positive control. Results represent means ± SE of three separate experiments.
Figure 6
Figure 6. TRAIL induces IL-8 production and ICAM-1 upregulation by PTEC
PTEC were stimulated with 2 ng/ml TRAIL for 48h. (A). IL-8 was measured in supernatant by Luminex assay. Results represent means ± SE of triplicate values and are representative of 3 separate experiments. *= p<0.05; **=p<0.005 versus media. (B). Surface expression of ICAM-1 was determined by flow cytometry. The filled curve represents the isotype control.

References

    1. Jeremias I, Herr I, Boehler T, Debatin KM. TRAIL/Apo-2-ligand-induced apoptosis in human T cells. Eur.J Immunol. 1998;28:143–152. - PubMed
    1. Morel J, Audo R, Hahne M, Combe B. Tumor necrosis factor-related apoptosis-inducing ligand (TRAIL) induces rheumatoid arthritis synovial fibroblast proliferation through mitogen-activated protein kinases and phosphatidylinositol 3-kinase/Akt. J Biol Chem. 2005;280:15709–15718. - PubMed
    1. Li JH, Kirkiles-Smith NC, McNiff JM, Pober JS. TRAIL induces apoptosis and inflammatory gene expression in human endothelial cells. J Immunol. 2003;171:1526–1533. - PubMed
    1. Wiley SR, Schooley K, Smolak PJ, Din WS, Huang CP, Nicholl JK, Sutherland GR, Smith TD, Rauch C, Smith CA, et al. Identification and characterization of a new member of the TNF family that induces apoptosis. Immunity. 1995;3:673–682. - PubMed
    1. Chaudhary PM, Eby M, Jasmin A, Bookwalter A, Murray J, Hood L. Death receptor 5, a new member of the TNFR family, and DR4 induce FADD-dependent apoptosis and activate the NF-kappaB pathway. Immunity. 1997;7:821–830. - PubMed

Publication types

MeSH terms

Substances