

Categorical and correlational analyses of baseline fluorodeoxyglucose positron emission tomography images from the Alzheimer's Disease Neuroimaging Initiative (ADNI)
- PMID: 19349228
- PMCID: PMC2886795
- DOI: 10.1016/j.neuroimage.2008.12.072
Categorical and correlational analyses of baseline fluorodeoxyglucose positron emission tomography images from the Alzheimer's Disease Neuroimaging Initiative (ADNI)
Abstract
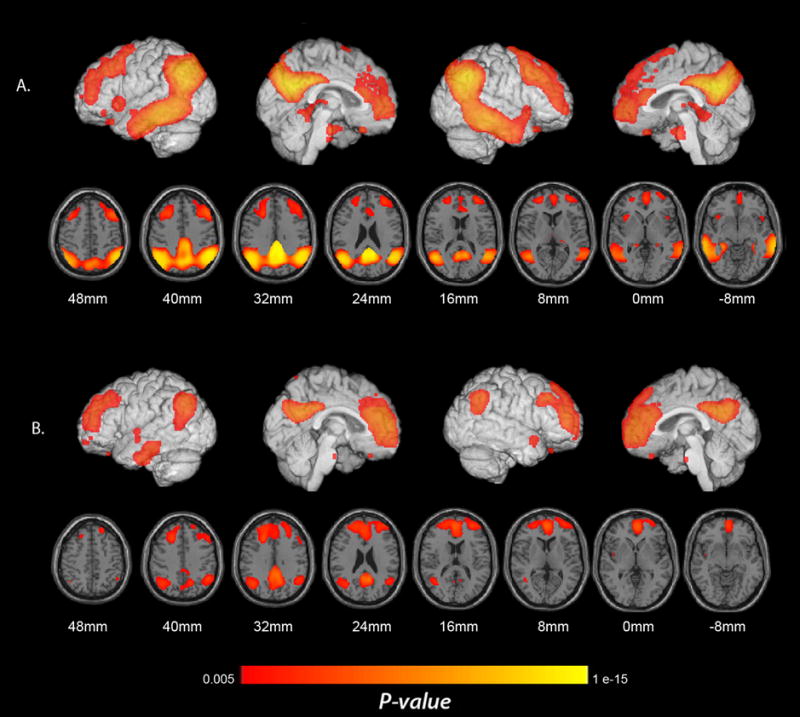
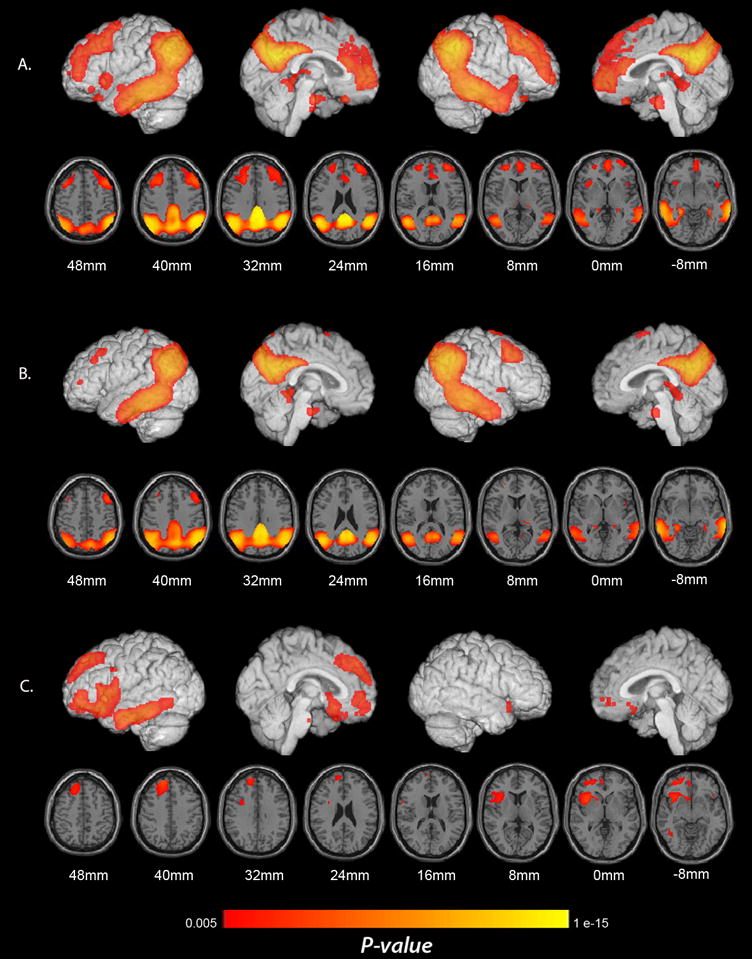
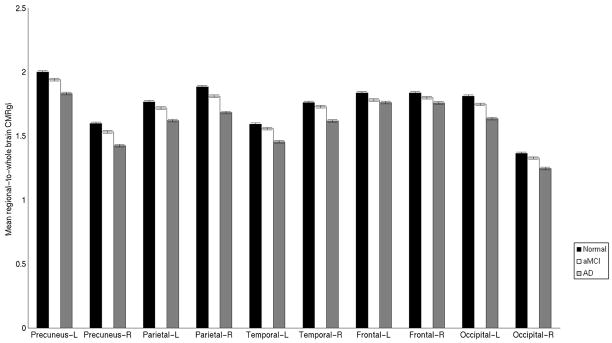
In mostly small single-center studies, Alzheimer's disease (AD) is associated with characteristic and progressive reductions in fluorodeoxyglucose positron emission tomography (PET) measurements of the regional cerebral metabolic rate for glucose (CMRgl). The AD Neuroimaging Initiative (ADNI) is acquiring FDG PET, volumetric magnetic resonance imaging, and other biomarker measurements in a large longitudinal multi-center study of initially mildly affected probable AD (pAD) patients, amnestic mild cognitive impairment (aMCI) patients, who are at increased AD risk, and cognitively normal controls (NC), and we are responsible for analyzing the PET images using statistical parametric mapping (SPM). Here we compare baseline CMRgl measurements from 74 pAD patients and 142 aMCI patients to those from 82 NC, we correlate CMRgl with categorical and continuous measures of clinical disease severity, and we compare apolipoprotein E (APOE) varepsilon4 carriers to non-carriers in each of these subject groups. In comparison with NC, the pAD and aMCI groups each had significantly lower CMRgl bilaterally in posterior cingulate, precuneus, parietotemporal and frontal cortex. Similar reductions were observed when categories of disease severity or lower Mini-Mental State Exam (MMSE) scores were correlated with lower CMRgl. However, when analyses were restricted to the pAD patients, lower MMSE scores were significantly correlated with lower left frontal and temporal CMRgl. These findings from a large, multi-site study support previous single-site findings, supports the characteristic pattern of baseline CMRgl reductions in AD and aMCI patients, as well as preferential anterior CMRgl reductions after the onset of AD dementia.
Figures
References
-
- Alexander GE, Chen K, Pietrini P, Rapoport SI, Reiman EM. Longitudinal PET evaluation of cerebral metabolic decline in dementia: A potential outcome measure in Alzheimer’s disease treatment studies. Am J Psychiatry. 2002;159:738–745. - PubMed
-
- Anchisi D, Borroni B, Franceschi M, Kerrouche N, Kalbe E, Beuthien-Beumann B, Cappa S, Lenz O, Ludecke S, Marcone A, Mielke R, Ortelli P, Padovani A, Pelati O, Pupi A, Scarpini E, Weisenbach S, Herholz K, Salmon E, Holthoff V, Sorbi S, Fazio F, Perani D. Heterogeneity of brain glucose metabolism in mild cognitive impairment and clinical progression to Alzheimer disease. Arch Neurol. 2005;62:1728–1733. - PubMed
-
- Arnaiz E, Jelic V, Almkvist O, Wahlund LO, Winblad B, Valind S, Nordberg A. Impaired cerebral glucose metabolism and cognitive functioning predict deterioration in mild cognitive impairment. Neuroreport. 2001;12:851–855. - PubMed
-
- Bokde AL, Teipel SJ, Drzezga A, Thissen J, Bartenstein P, Dong W, Leinsinger G, Born C, Schwaiger M, Moeller HJ, Hampel H. Association between cognitive performance and cortical glucose metabolism in patients with mild Alzheimer’s disease. Dement Geriatr Cogn Disord. 2005;20:352–357. - PubMed
-
- Chase TN, Foster NL, Fedio P, Brooks R, Mansi L, Di Chiro G. Regional cortical dysfunction in Alzheimer’s disease as determined by positron emission tomography. Ann Neurol. 1984;15(Suppl):S170–S174. - PubMed
Publication types
MeSH terms
Substances
Grants and funding
LinkOut - more resources
Full Text Sources
Medical
Miscellaneous
