. 2009 Jun 5;284(23):15541-8.
doi: 10.1074/jbc.M900888200. Epub 2009 Apr 6.

Signaling processes for initiating smooth muscle contraction upon neural stimulation

Affiliations

Signaling processes for initiating smooth muscle contraction upon neural stimulation

Hai-Lei Ding et al. J Biol Chem. .

Abstract

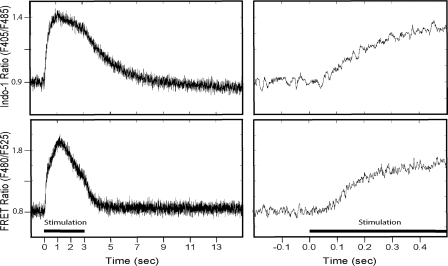
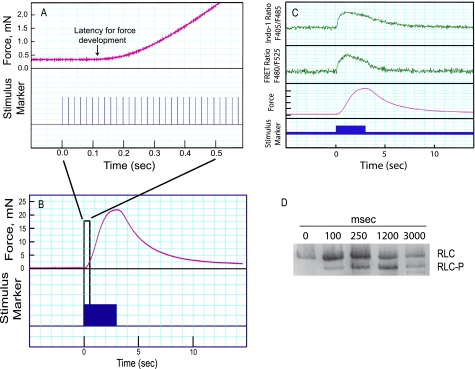
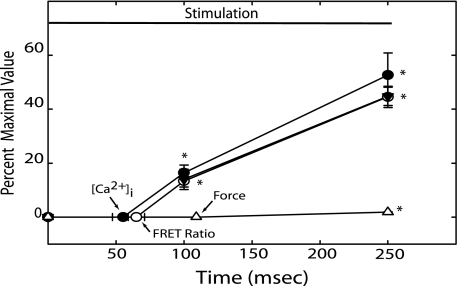
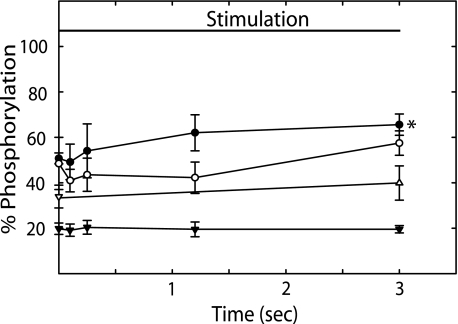
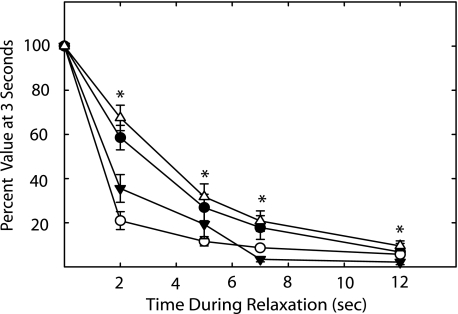
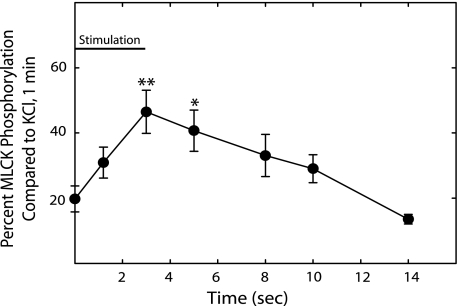
Relationships among biochemical signaling processes involved in Ca2+/calmodulin (CaM)-dependent phosphorylation of smooth muscle myosin regulatory light chain (RLC) by myosin light chain kinase (MLCK) were determined. A genetically-encoded biosensor MLCK for measuring Ca(2+)-dependent CaM binding and activation was expressed in smooth muscles of transgenic mice. We performed real-time evaluations of the relationships among [Ca2+](i), MLCK activation, and contraction in urinary bladder smooth muscle strips neurally stimulated for 3 s. Latencies for the onset of [Ca2+](i) and kinase activation were 55 +/- 8 and 65 +/- 6 ms, respectively. Both increased with RLC phosphorylation at 100 ms, whereas force latency was 109 +/- 3 ms. [Ca2+](i), kinase activation, and RLC phosphorylation responses were maximal by 1.2 s, whereas force increased more slowly to a maximal value at 3 s. A delayed temporal response between RLC phosphorylation and force is probably due to mechanical effects associated with elastic elements in the tissue. MLCK activation partially declined at 3 s of stimulation with no change in [Ca2+](i) and also declined more rapidly than [Ca2+](i) during relaxation. The apparent desensitization of MLCK to Ca2+ activation appears to be due to phosphorylation in its calmodulin binding segment. Phosphorylation of two myosin light chain phosphatase regulatory proteins (MYPT1 and CPI-17) or a protein implicated in strengthening membrane adhesion complexes for force transmission (paxillin) did not change during force development. Thus, neural stimulation leads to rapid increases in [Ca2+](i), MLCK activation, and RLC phosphorylation in phasic smooth muscle, showing a tightly coupled Ca2+ signaling complex as an elementary mechanism initiating contraction.


Figures

FIGURE 1.
FIGURE 1.
Fluorescence ratio data for Indo-1 and MLCK CaM-sensor. Traces are derived from the average values obtained from a single strip for repeated contractions to 50 Hz for 3 s, as indicated by the stimulation bar. Right column is the expanded time scale to illustrate latency.
FIGURE 2.
FIGURE 2.
Measurements of isometric force, Indo-1 ratio, FRET ratio, and RLC phosphorylation in electrically stimulated bladder smooth muscle strips. A, representative force tracing (upper channel) upon electric field stimulation (lower channel) during the initial 0.5-s stimulation of a bladder strip from a CaM-sensor transgenic mouse. Stimulus pulses were delivered at 50 Hz. Arrow indicates the estimated time of latency for force development. Initiation of the stimulus train is designated time 0. B, representative force tracing for a 3-s electric field stimulation followed by 12 s relaxation. The response within the black rectangle was amplified to show the latency for force development in A. C, recordings of Indo-1 ratio, FRET ratio, and force responses in bladder strips stimulated for 3 s as indicated by the stimulus marker. Indo-1 ratio and FRET ratio are representative single traces from 2 strips filtered at 50 Hz. D, immunoblot following urea/glycerol-PAGE to separate phosphorylated RLC (RLC-P) from the nonphosphorylated RLC for strips frozen at the indicated times after the onset of stimulation.
FIGURE 3.
FIGURE 3.
Latencies and time course of [Ca2+]i, FRET ratio, RLC phosphorylation, and force during the initial 250 ms of electrical stimulation. Values of [Ca2+]i (●), FRET ratio (○), RLC phosphorylation (▼), and force (Δ) at the indicated times are expressed as a fraction of maximal values obtained with electric field stimulation. Arrows indicate average times for latency of the indicated parameter. Values are mean ± S.E. (n = 4 to 9). *, p < 0.05 versus resting value.
FIGURE 4.
FIGURE 4.
Time course of [Ca2+]i, FRET ratio, RLC phosphorylation, and force during 3 s of electrical stimulation. Values of [Ca2+]i (●), FRET ratio (○), RLC phosphorylation (▼), and force (Δ) at the indicated times are expressed as a fraction of maximal obtained with electric field stimulation. Values are mean ± S.E. (n = 5 to 12). *, p < 0.05 versus resting values (all values significantly changed at each time after 0 s as shown by one asterisk for each time).
FIGURE 5.
FIGURE 5.
MYPT1Thr-696, MYPT1Thr-850, CPI-17, and paxillin phosphorylation during 3 s of electrical stimulation. MYPT1Thr-696 (●), MYPT1Thr-850 (○), CPI-17 (▼), and paxillin (Δ) phosphorylation at the indicated times during a 3-s field stimulation. For MYPT1Thr-696, MYPT1Thr-850, and paxillin phosphorylation, results are expressed relative to values obtained with 10 μm carbachol at 1 (MYPT1) and 5 (paxillin) min. For CPI-17 phosphorylation, results are expressed as percent of total CPI phosphorylated (14). Values are mean ± S.E. (n = 4 to 6). *, p < 0.05 versus resting values.
FIGURE 6.
FIGURE 6.
[Ca2+]i, FRET ratio, RLC phosphorylation, and force during relaxation after 3 s of electrical stimulation. Strips were frozen at the indicated times during relaxation. Values of [Ca2+]i (●), FRET ratio (○), RLC phosphorylation (▼), and force (Δ) are expressed as percent of values at 3 s. Values are mean ± S.E. (n = 4 to 9). *, p < 0.05 versus resting values (all values significantly changed after 0 s as shown by one asterisk for each time).
FIGURE 7.
FIGURE 7.
MLCK phosphorylation during contraction and relaxation with electrical stimulation. Results are expressed relative to values obtained at 1 min with 65 mm KCl. Values are mean ± S.E. (n = 4 to 8). *, p < 0.05 versus resting value. **, p < 0.01 versus resting values.

References

    1. Kamm K. E., Stull J. T. ( 1985) Annu. Rev. Pharmacol. Toxicol. 25, 593– 620 - PubMed
    1. Somlyo A. P., Somlyo A. V. ( 2000) J. Physiol. 522, 177– 185 - PMC - PubMed
    1. He W. Q., Peng Y. J., Zhang W. C., Lv N., Tang J., Chen C., Zhang C. H., Gao S., Chen H. Q., Zhi G., Feil R., Kamm K. E., Stull J. T., Gao X., Zhu M. S. ( 2008) Gastroenterology 135, 610– 620 - PMC - PubMed
    1. Tansey M. G., Luby-Phelps K., Kamm K. E., Stull J. T. ( 1994) J. Biol. Chem. 269, 9912– 9920 - PubMed
    1. Zimmermann B., Somlyo A. V., Ellis-Davies G. C., Kaplan J. H., Somlyo A. P. ( 1995) J. Biol. Chem. 270, 23966– 23974 - PubMed

Publication types

LinkOut - more resources